Fig. 7
Download original image
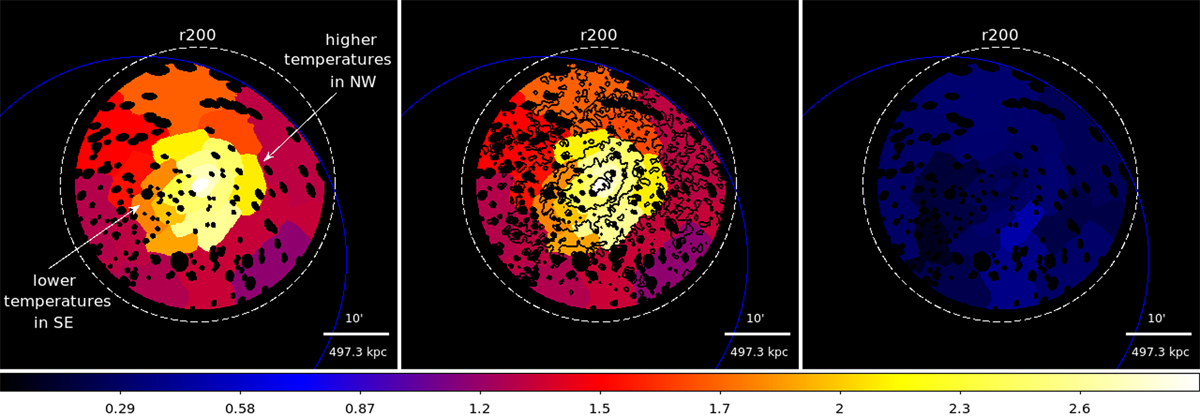
Temperature map of A3408. The eROSITA FoV (blue) and r200 (dashed white line) are indicated. Left: temperature map with an additional annulus of 4–12 (black) for visualization. Center, temperature map with surface brightness contours generated from the particle background-subtracted and exposure-corrected soft-band image overlaid in black. Right: relative errors for each temperature in the corresponding bin.
Current usage metrics show cumulative count of Article Views (full-text article views including HTML views, PDF and ePub downloads, according to the available data) and Abstracts Views on Vision4Press platform.
Data correspond to usage on the plateform after 2015. The current usage metrics is available 48-96 hours after online publication and is updated daily on week days.
Initial download of the metrics may take a while.