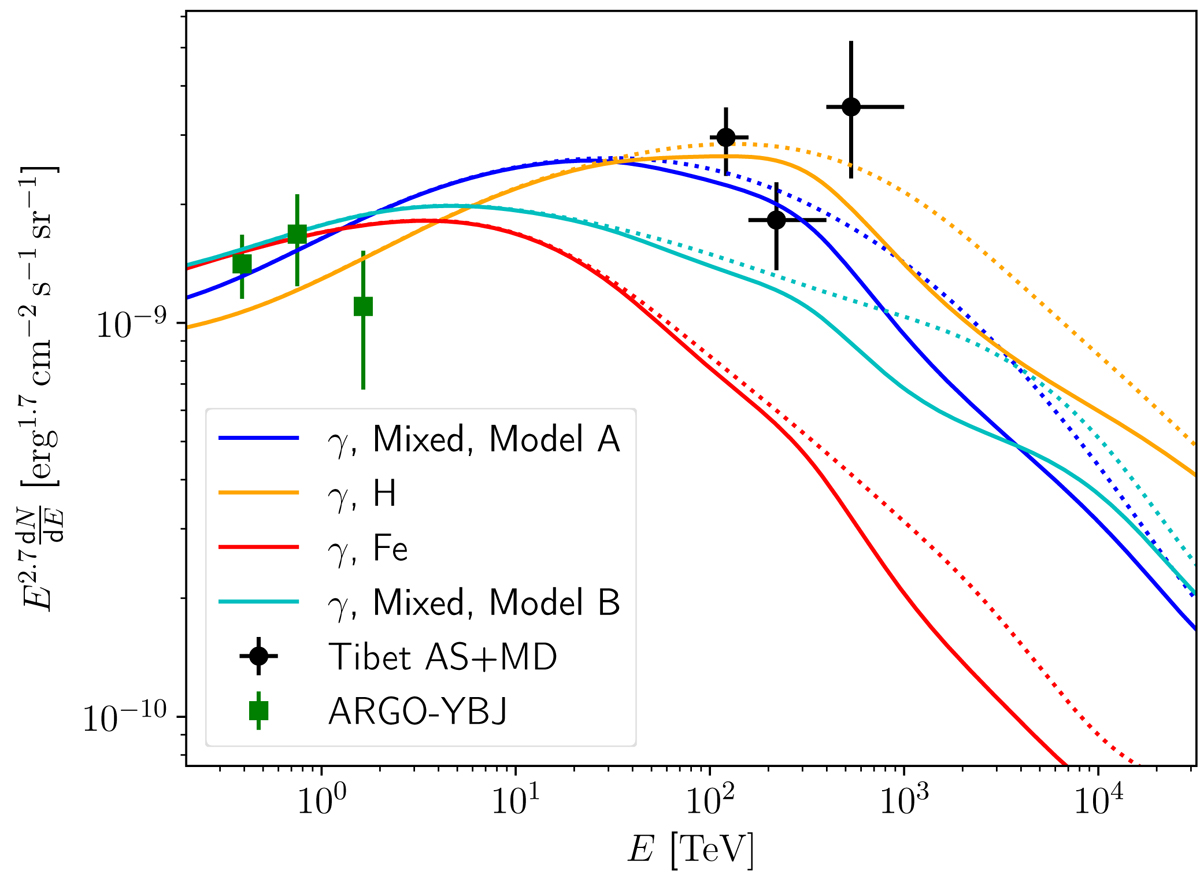
Fig. 5.
Download original image
Gamma-ray fluxes from different CR models together with data from ARGO-YBJ (Bartoli et al. 2015) and the Tibet air shower array and muon detector array (Tibet AS+MD) (Amenomori et al. 2021) for Galactic longitudes 25° ≤l ≤ 100° and Galactic latitudes with |b|≤5°. Each colour represents a different CR model; the solid lines are with absorption, and the corresponding dotted lines without. The curves are normalised by a fit on the data by taking the absorption into account. The blue colour represents Model A, with all different CR species. The orange and red curves assume that all CR species of Model A are hydrogen or iron, respectively. The cyan curve is the emission from Model B, where the H and He CR spectra are changed with respect to Model A. The corresponding all-sky Galactic neutrino fluxes are shown in Fig. 6.
Current usage metrics show cumulative count of Article Views (full-text article views including HTML views, PDF and ePub downloads, according to the available data) and Abstracts Views on Vision4Press platform.
Data correspond to usage on the plateform after 2015. The current usage metrics is available 48-96 hours after online publication and is updated daily on week days.
Initial download of the metrics may take a while.