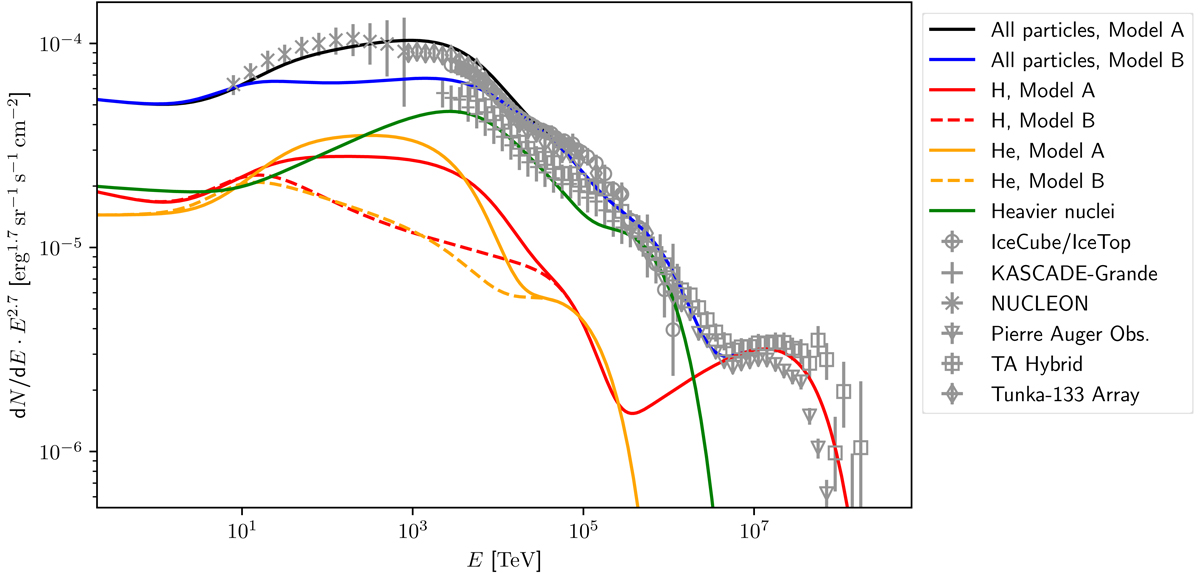
Fig. 3.
Download original image
All-particle CR data from IceCube/IceTop (Rawlins & IceCube Collaboration 2015), KASCADE-Grande (Schoo et al. 2015), NUCLEON (Grebenyuk et al. 2019), the Pierre Auger Observatory (The Pierre Auger Collaboration 2015), the Telescope Array (Ivanov 2015), and the Tunka-133 Array (Prosin et al. 2014). The black line shows the all-particle spectrum from Model A and the blue line that from Model B. We also show separately the spectra of hydrogen (red) and helium (orange), where solid lines are for Model A and dashed lines for Model B. The combined spectrum of all species heavier than H and He is depicted with the green line, which is the same for Model A as for Model B (see text for more details). The model curves for hydrogen and helium, together with the corresponding single-particle data, are displayed in Fig. 4. The corresponding figures for the different heavier nucleus species are shown in Appendix C.
Current usage metrics show cumulative count of Article Views (full-text article views including HTML views, PDF and ePub downloads, according to the available data) and Abstracts Views on Vision4Press platform.
Data correspond to usage on the plateform after 2015. The current usage metrics is available 48-96 hours after online publication and is updated daily on week days.
Initial download of the metrics may take a while.