Fig. 8
Download original image
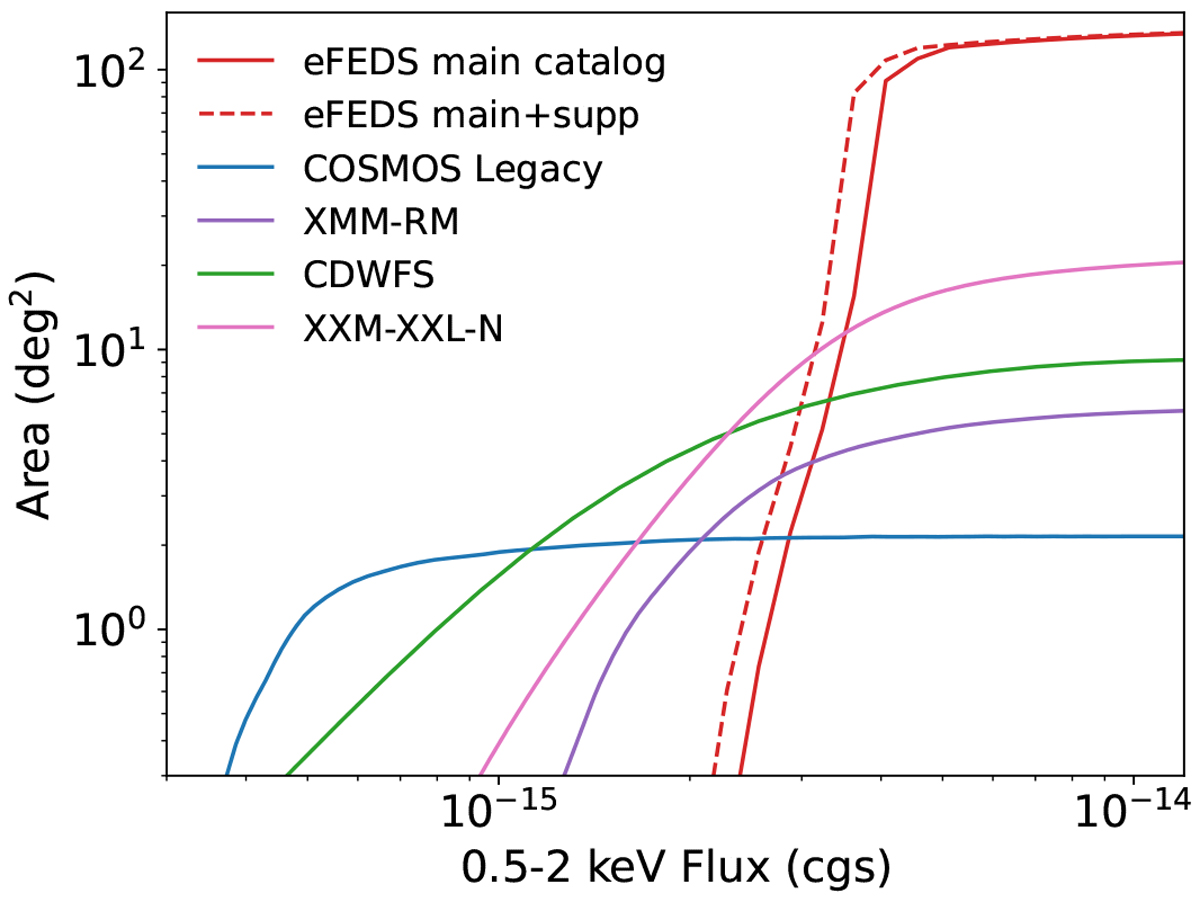
eFEDS sky coverage area (red) as a function of 0.5–2 keV flux calculated using ersensmap at two detection likelihood threshold 5 (for the full single-band sample) and 6 (for the main catalogue). The sky coverage of a few previous contiguous X-ray surveys are plotted for comparison.
Current usage metrics show cumulative count of Article Views (full-text article views including HTML views, PDF and ePub downloads, according to the available data) and Abstracts Views on Vision4Press platform.
Data correspond to usage on the plateform after 2015. The current usage metrics is available 48-96 hours after online publication and is updated daily on week days.
Initial download of the metrics may take a while.