Fig. B.1
Download original image
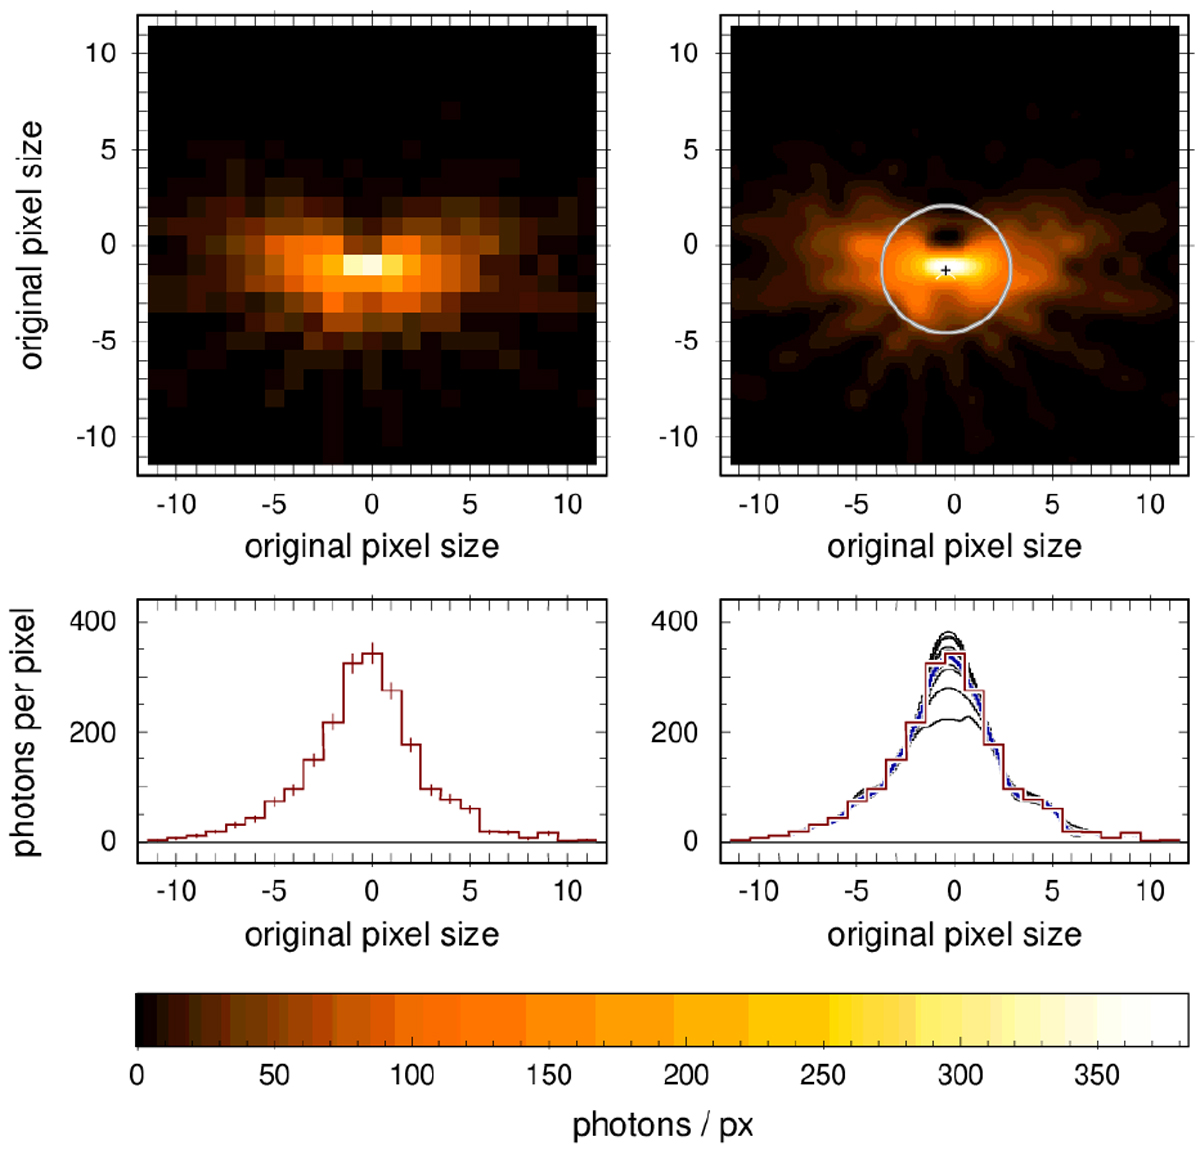
Example of the 1.5 keV TM1 PSF at an off-axis angle of 30’ in the original resolution (left) and the reconstructed resolution (right), where each original pixel is sub-divided into 10 × 10 sub-pixels. The histograms at the bottom show the flux distribution in the brightest pixel row (left) and in the ten corresponding sub-pixel rows (right). The modified bicubic resampling method enhances fine structures. The white circle indicates the minimum HEW.
Current usage metrics show cumulative count of Article Views (full-text article views including HTML views, PDF and ePub downloads, according to the available data) and Abstracts Views on Vision4Press platform.
Data correspond to usage on the plateform after 2015. The current usage metrics is available 48-96 hours after online publication and is updated daily on week days.
Initial download of the metrics may take a while.