Fig. 14
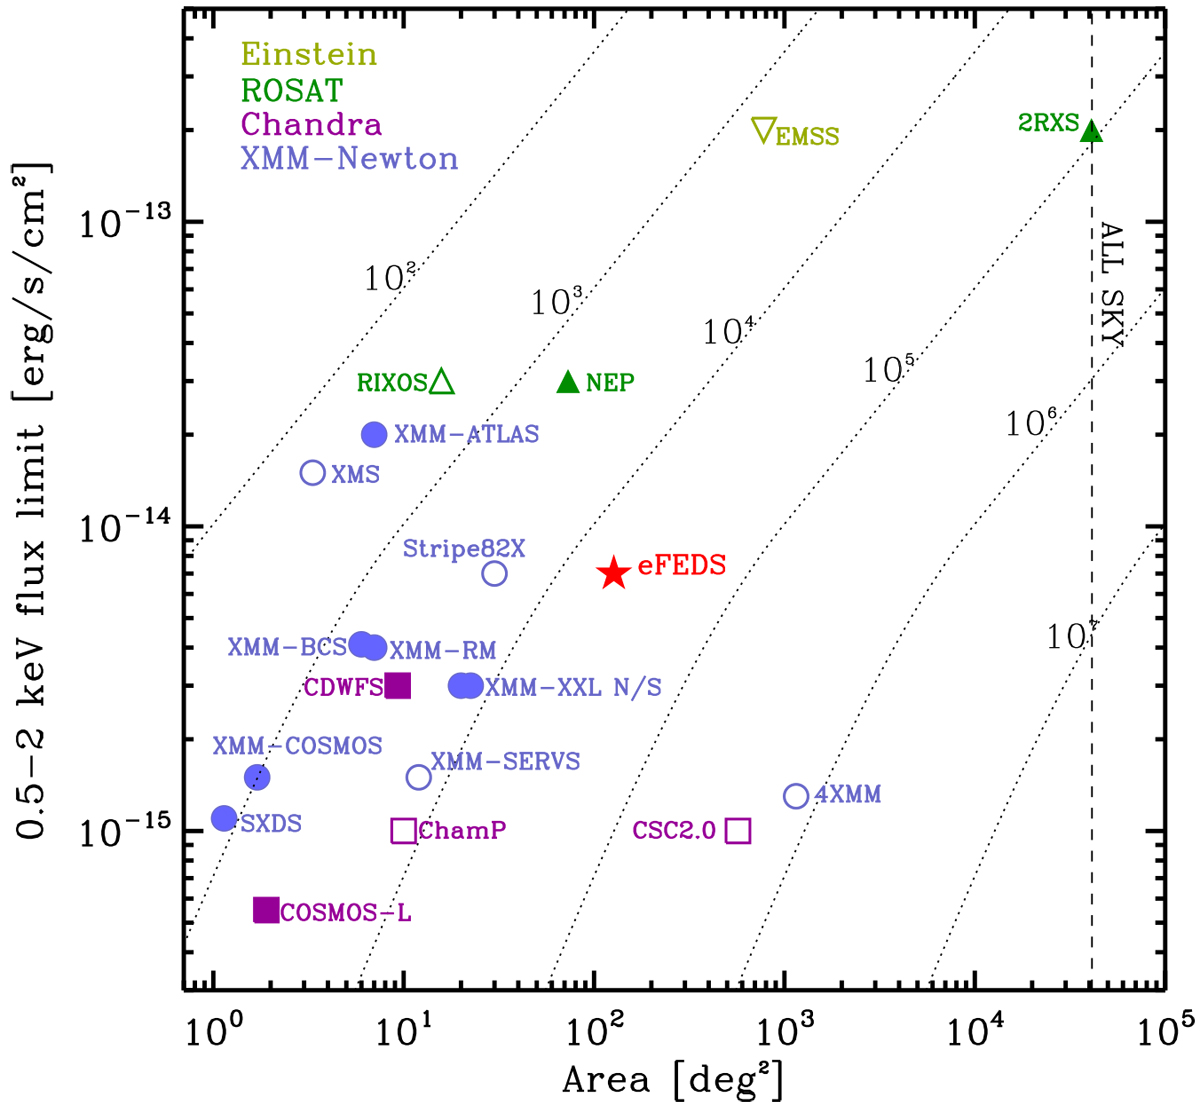
Download original image
Point-sources flux limit (in the 0.5–2 keV energy range) vs. area scatter plot of a few selected X-ray surveys larger than 1 deg2. Existing surveys from Einstein (light green downward triangle), ROSAT (dark green upward triangles), XMM-Newton (blue circles), and Chandra (purple squares) are shown for reference. Filled points mark contiguous surveys, and empty points show non-contiguous ones. To allow a fair comparison, we considered the total area that was covered (x-axis) for each survey and a flux limit that corresponds roughly to a completeness level of 66%. The dotted lines mark the loci of constant source numbers based on the number counts in the 0.5–2 keV energy rage of Mateos et al. (2008) (double power-law model). The surveys from left to right are The Subaru/ XMM-Newton Deep Survey (SXDS; Ueda et al. 2008); the XMM-COSMOS survey (Cappelluti et al. 2009); the COSMOS-Legacy survey (Civano et al. 2016); the XMM-Newton Medium Survey (XMS; Barcons et al. 2003); the XMM-Newton Bright Survey (XMM-BCS; Della Ceca et al. 2004); the XMM-RM survey (Liu et al. 2020); the XMM-ATLAS survey (Ranalli et al. 2015); the Chandra Deep Wide Field Survey (CDWFS; Masini et al. 2020); the Chandra Multiwavelength Project (ChamP; Kim et al. 2007); XMM-SERVS (Brandt 2020); the ROSAT International X-ray/Optical Survey (RIXOS; Mason et al. 2000); XMM-XXL N & S (Chiappetti et al. 2018); Stripe82X (LaMassa et al. 2016); NEP (Henry et al. 2006); the second Chandra Serendipitous Sources catalogue (CSC2.0; Civano, priv. comm.); the Einstein Observatory Extended Medium-Sensitivity Survey (EMSS; Gioia et al. 1990); the fourth XMM-Newton serendipitous source catalogue (4XMM; Webb et al. 2020), and the second ROSAT all-sky survey catalogue (2RXS Boller et al. 2016).
Current usage metrics show cumulative count of Article Views (full-text article views including HTML views, PDF and ePub downloads, according to the available data) and Abstracts Views on Vision4Press platform.
Data correspond to usage on the plateform after 2015. The current usage metrics is available 48-96 hours after online publication and is updated daily on week days.
Initial download of the metrics may take a while.