Fig. 13
Download original image
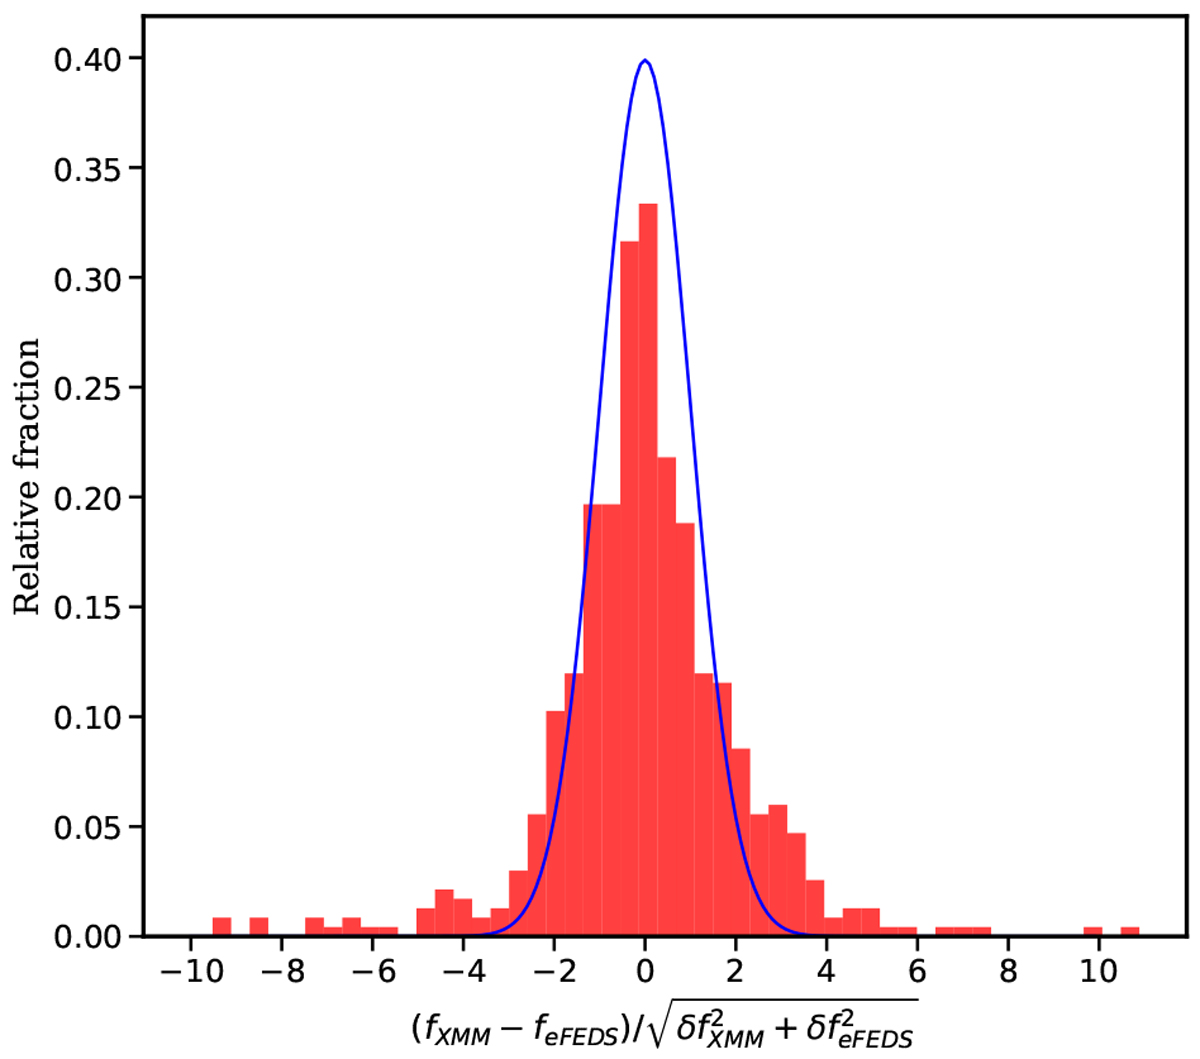
Distribution of the flux difference of X-ray sources between the XMM-ATLAS and eFEDS observations normalised by the corresponding flux uncertainties added in quadrature. The blue line shows a Gaussian distribution with a mean of zero and a scatter of unity.
Current usage metrics show cumulative count of Article Views (full-text article views including HTML views, PDF and ePub downloads, according to the available data) and Abstracts Views on Vision4Press platform.
Data correspond to usage on the plateform after 2015. The current usage metrics is available 48-96 hours after online publication and is updated daily on week days.
Initial download of the metrics may take a while.