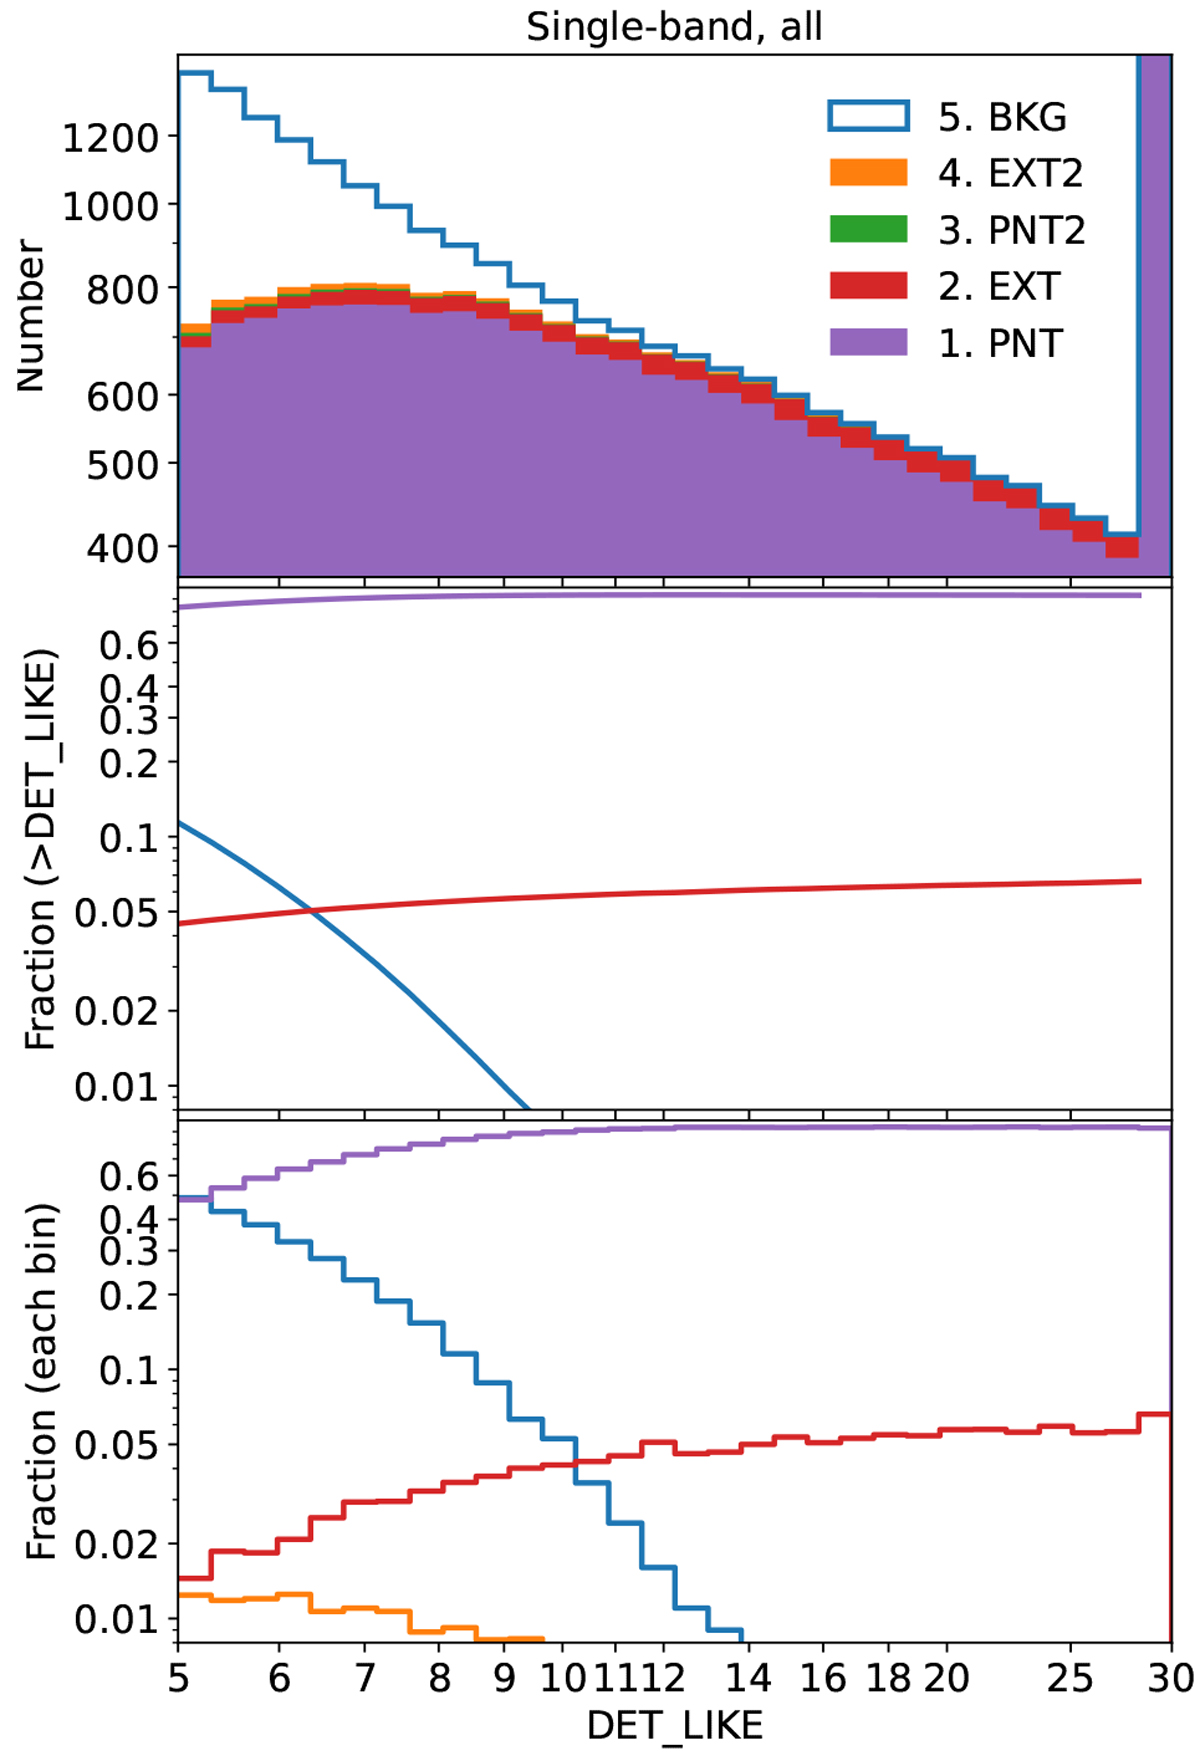
Fig. 11

Download original image
Distributions of all the single-band detected sources as a function of detection likelihood. Top panel: histogram of the detected sources. Bottom panel: fraction of each class in each bin (differential distributions). Middle panel: fraction of each class above a given detection likelihood (cumulative distributions). The colour code for the various classes considered here is as follows: purple shows primary counterparts of input point sources, red shows primary counterparts of input clusters, green shows secondary counterparts of input point sources, orange shows secondary counterparts of input clusters, and blue shows spurious sources (background fluctuations). The fractions of green and orange sources are so low that they are not always visible.
Current usage metrics show cumulative count of Article Views (full-text article views including HTML views, PDF and ePub downloads, according to the available data) and Abstracts Views on Vision4Press platform.
Data correspond to usage on the plateform after 2015. The current usage metrics is available 48-96 hours after online publication and is updated daily on week days.
Initial download of the metrics may take a while.


