Fig. 10
Download original image
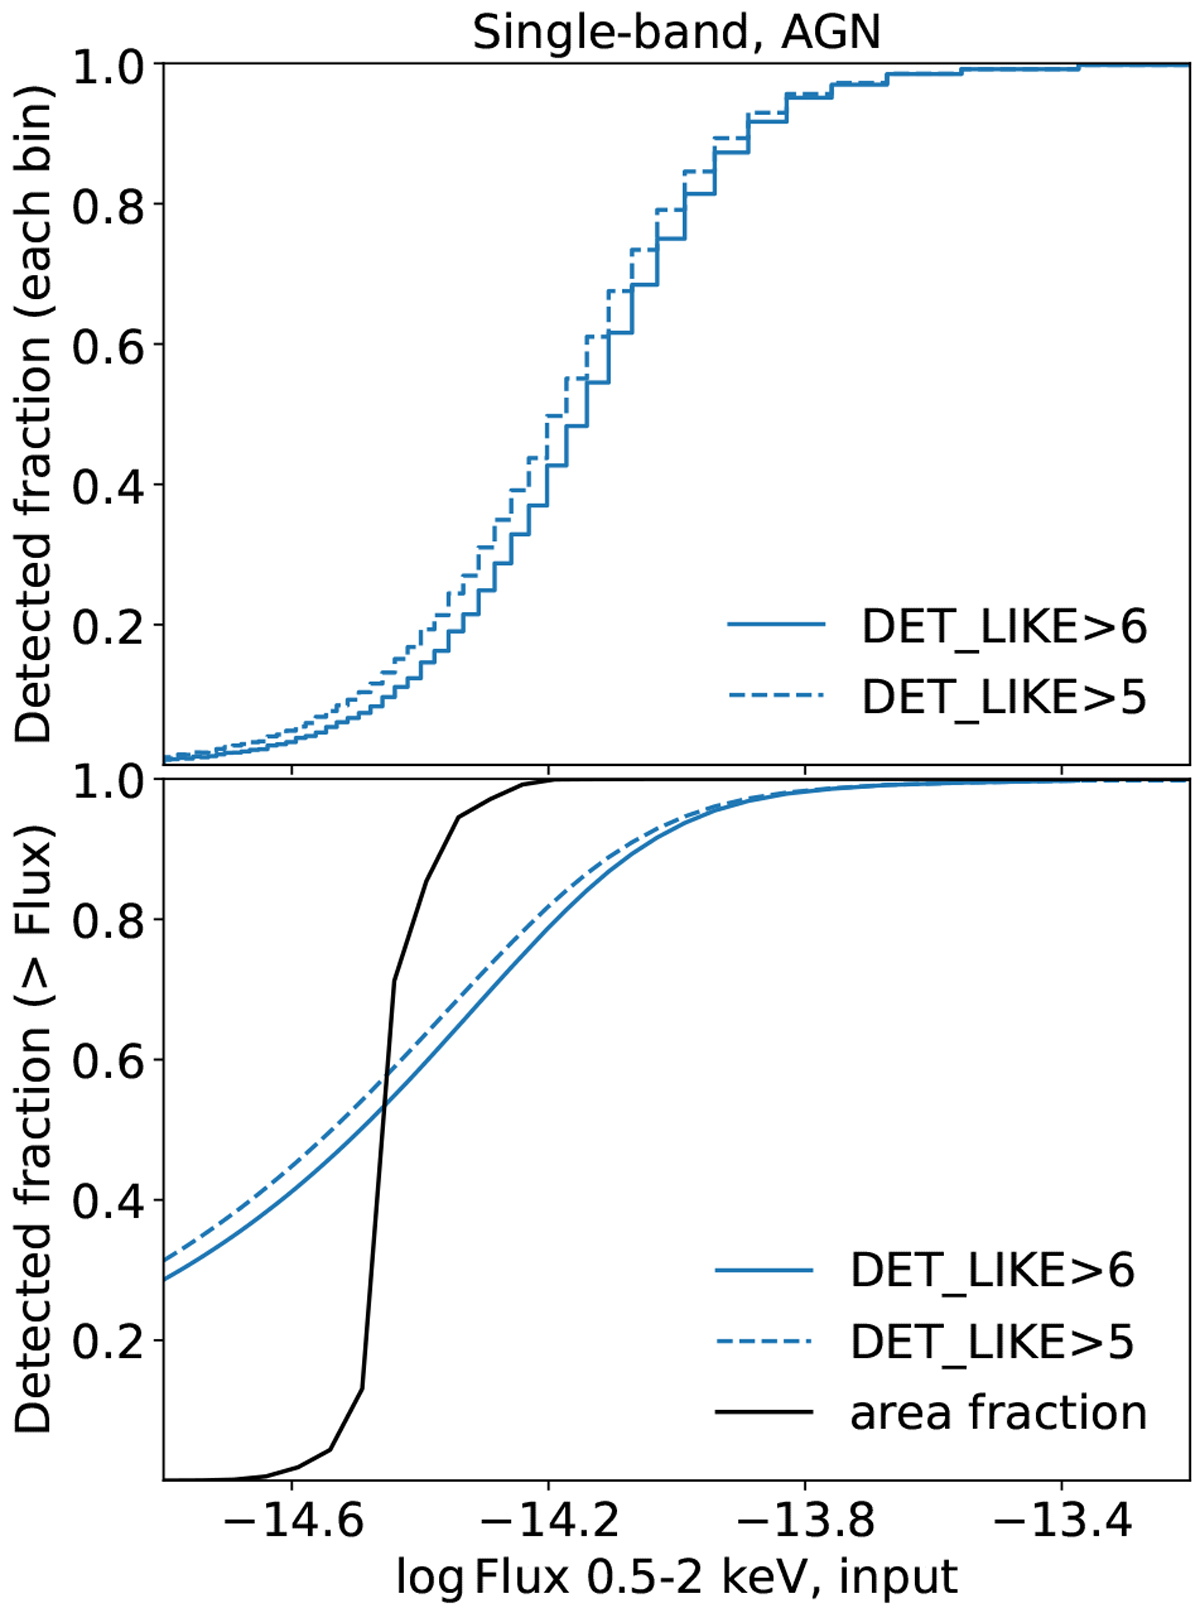
Simulation-measured completeness of AGN in the single-band detected catalogue as a function of the 0.5–2 keV input flux (erg cm2 s–1) in differential (upper panel) and cumulative manners. The solid and dashed blue lines indicate the detected AGN with DET_LIKE > 6 and DET_LIKE > 5, respectively. For comparison, we also plot the sky coverage area curve measured by ersensmap adopting DET_LIKE ≥ 5 normalised to a total area of 1 (black line).
Current usage metrics show cumulative count of Article Views (full-text article views including HTML views, PDF and ePub downloads, according to the available data) and Abstracts Views on Vision4Press platform.
Data correspond to usage on the plateform after 2015. The current usage metrics is available 48-96 hours after online publication and is updated daily on week days.
Initial download of the metrics may take a while.