Fig. 1
Download original image
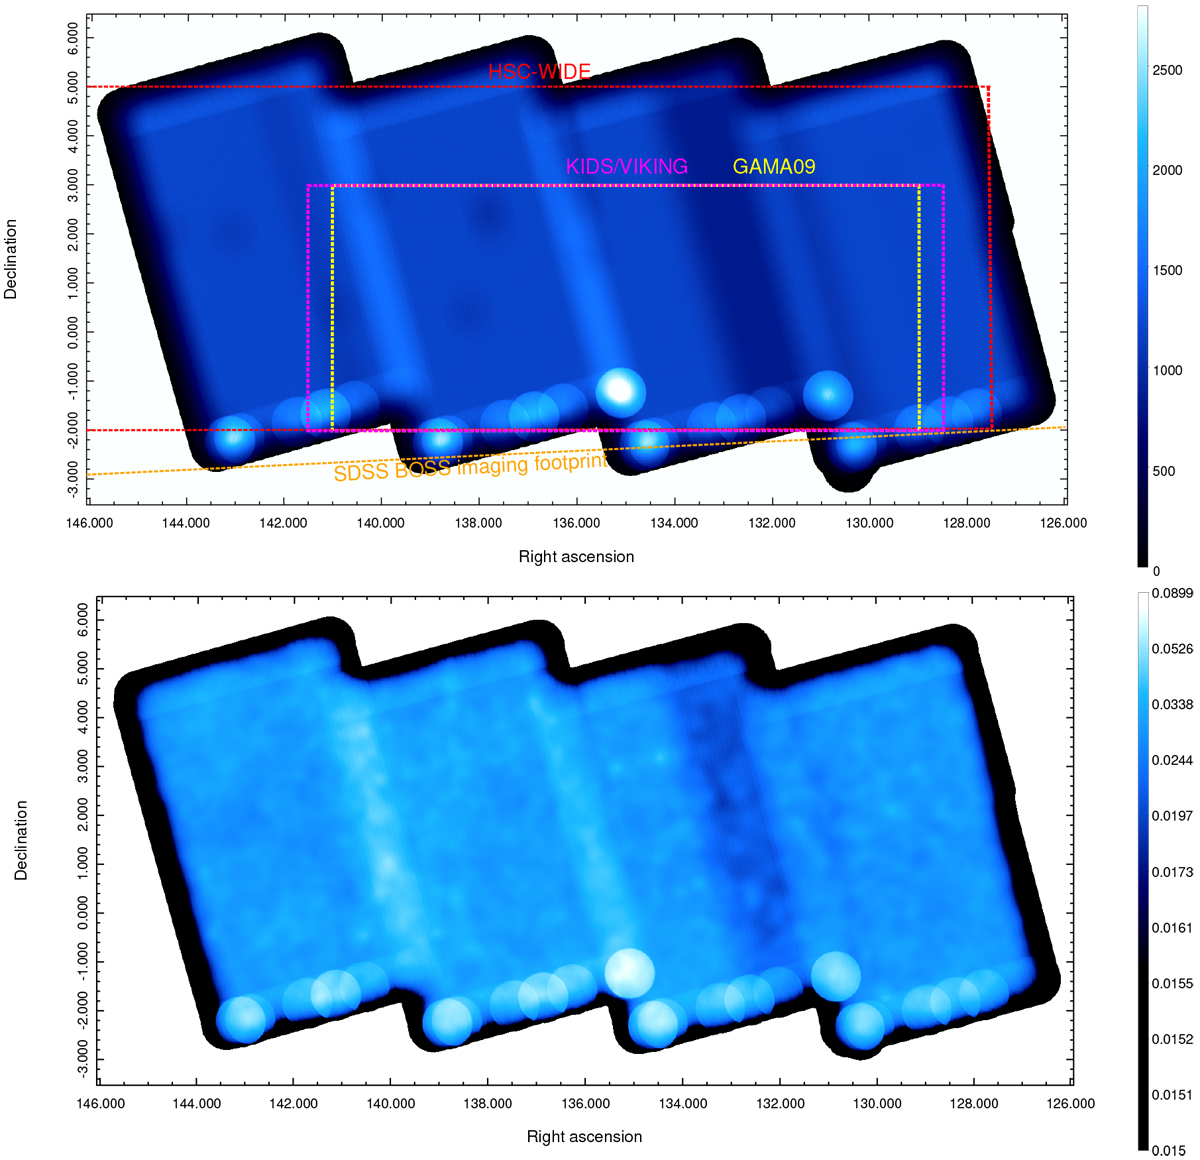
0.2–2.3 keV exposure map (vignetting corrected, in units of seconds; upper panel) and background map (in units of counts per pixel; lower panel). The bright circles mark high-exposure regions and are a result of the scanning mode used in the observations. They are created due to the waiting time of the spacecraft before inverting its scanning direction. The darker stripe in the second rectangular chunk on the right is due to the malfunction of two of the seven eROSITA cameras during that period. The upper panel also shows the footprints of a few relevant optical and NIR, imaging and spectroscopic surveys.
Current usage metrics show cumulative count of Article Views (full-text article views including HTML views, PDF and ePub downloads, according to the available data) and Abstracts Views on Vision4Press platform.
Data correspond to usage on the plateform after 2015. The current usage metrics is available 48-96 hours after online publication and is updated daily on week days.
Initial download of the metrics may take a while.