Fig. 7
Download original image
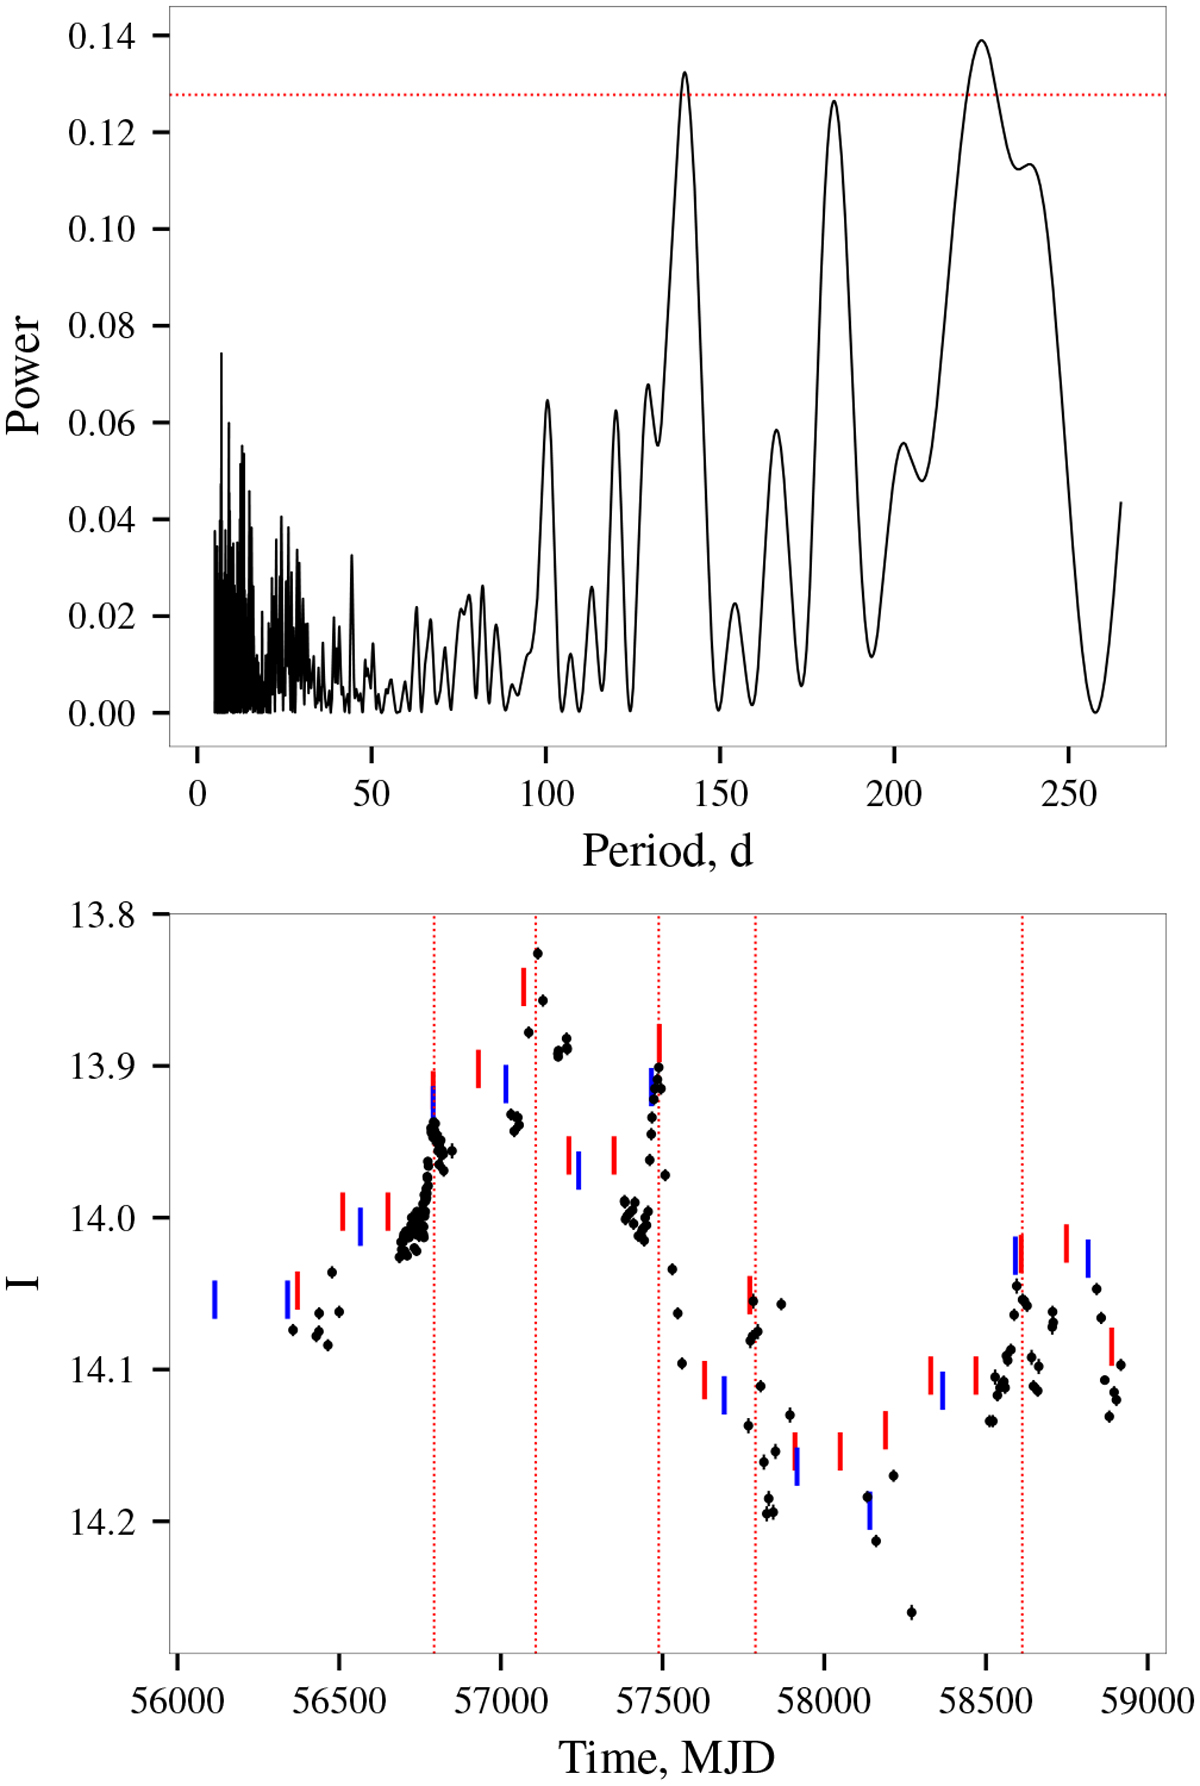
Generalized Lomb–Scargle periodogram for OGLE I-band light curve of SRGA J124404.1–632232/SRGU J124403.8–632231 counterpart (top). The red line indicates the expected 3σ upper limit on the noise amplitude. Two peaks exceeding the noise level correspond to periods of ~138 and ~225 d. OGLE I-band light curve (bottom, black points). The five short, quasi-periodic flares are indicated with dotted red lines. The short vertical lines indicate expected flare timings assuming that they are related to the orbital phase, with an orbital period of either 138 d (red) or 225 d (blue).
Current usage metrics show cumulative count of Article Views (full-text article views including HTML views, PDF and ePub downloads, according to the available data) and Abstracts Views on Vision4Press platform.
Data correspond to usage on the plateform after 2015. The current usage metrics is available 48-96 hours after online publication and is updated daily on week days.
Initial download of the metrics may take a while.