Fig. 6
Download original image
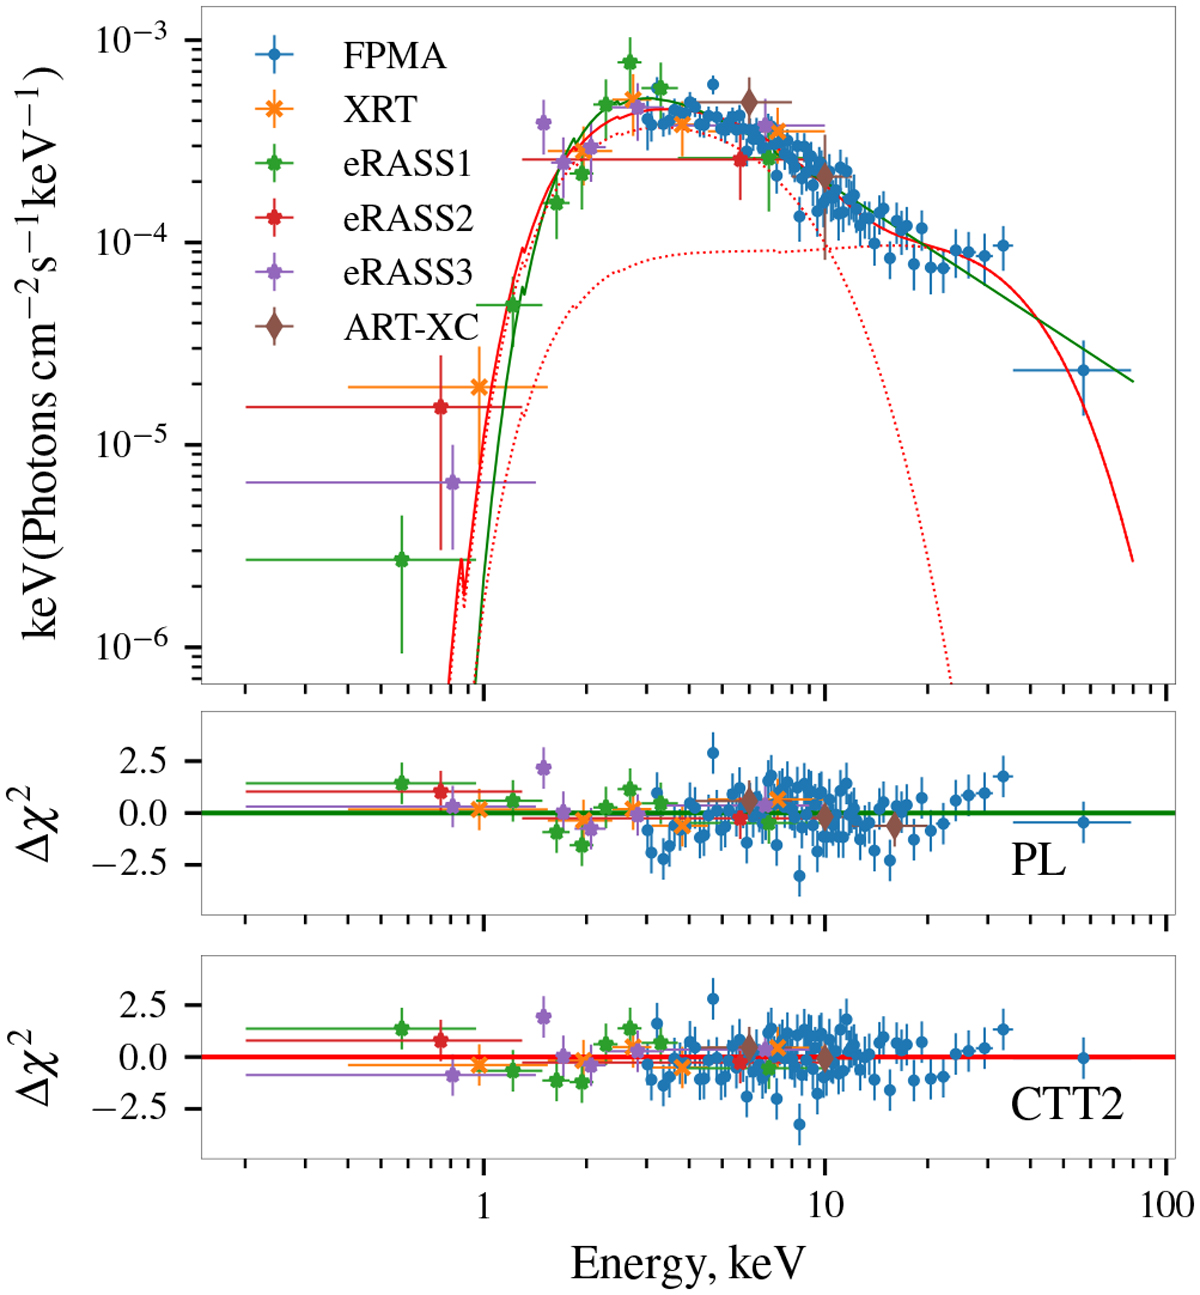
Unfolded spectrum of the source assuming the best-fit CompTT2 model. All spectra were rebinned (to 10 (eROSITA and Swift/XRT) or 25 counts (NuSTAR) per energy bin) and scaled using the best-fit cross-normalization constants listed in Table 2. For clarity, only FPMA data for NuSTAR are shown because the spectra from the two modules look nearly identical.
Current usage metrics show cumulative count of Article Views (full-text article views including HTML views, PDF and ePub downloads, according to the available data) and Abstracts Views on Vision4Press platform.
Data correspond to usage on the plateform after 2015. The current usage metrics is available 48-96 hours after online publication and is updated daily on week days.
Initial download of the metrics may take a while.