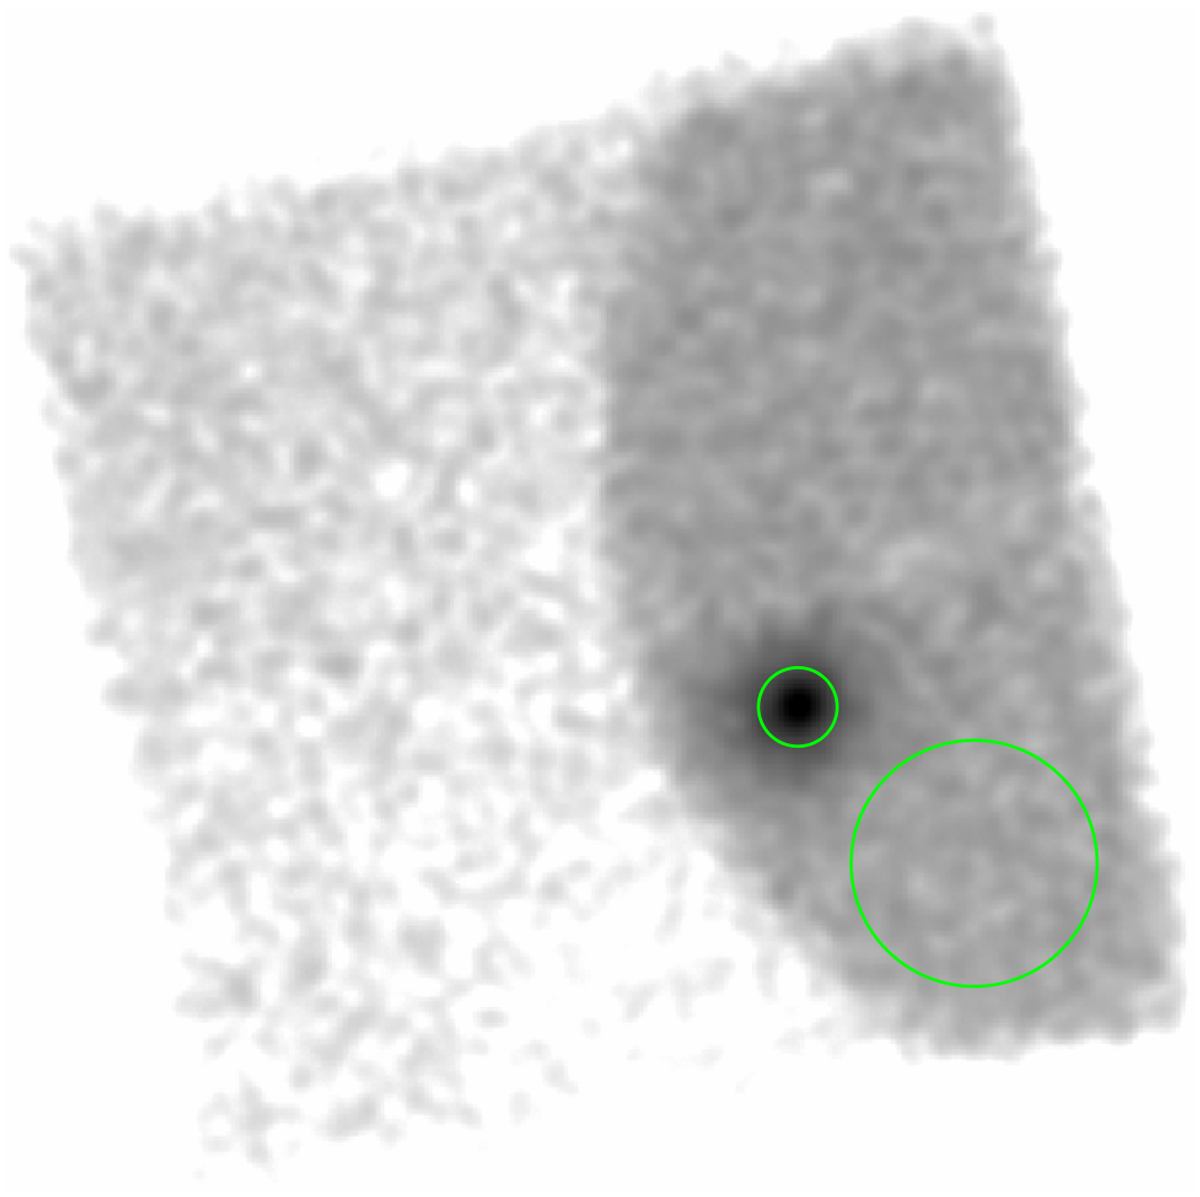
Fig. 2
Download original image
Smoothed plane image for the NuSTAR FPMA detector unit in the 3–20 keV energy band. Note the stray light contamination from GX 301–2. The locations of the source and background extraction regions are also shown (green circles).
Current usage metrics show cumulative count of Article Views (full-text article views including HTML views, PDF and ePub downloads, according to the available data) and Abstracts Views on Vision4Press platform.
Data correspond to usage on the plateform after 2015. The current usage metrics is available 48-96 hours after online publication and is updated daily on week days.
Initial download of the metrics may take a while.