Fig. 1
Download original image
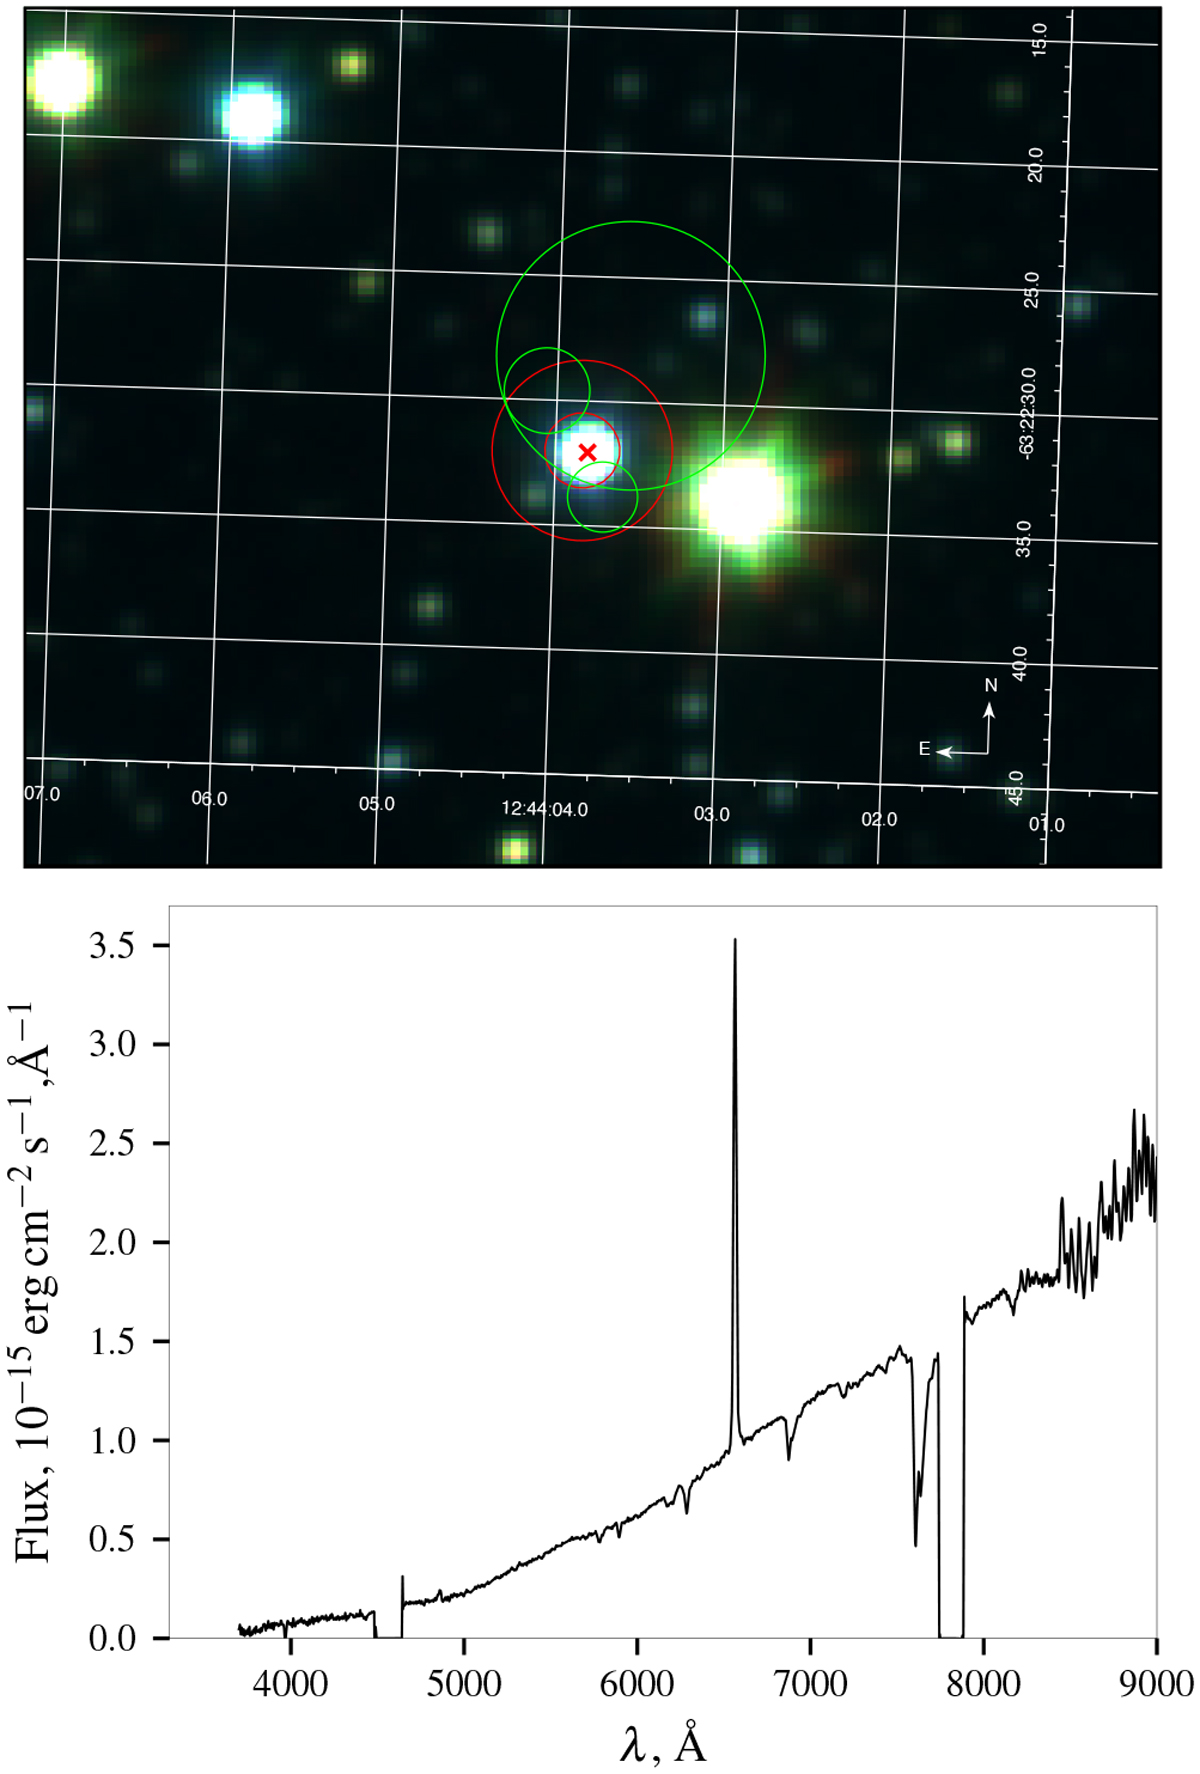
Top panel: VVV (JHKS) image of the region around the X-ray source. The green circles indicate the source position as observed by eROSITA in eRASS1-3, the red contours represent the 1σ and 3σ uncertainties for the refined position obtained as described in the text. The 2MASS position of the suggested near-infrared counterpart is indicated by the red cross. Bottom panel: spectrum of the optical counterpart as observed by SALT, note the prominent Hα line.
Current usage metrics show cumulative count of Article Views (full-text article views including HTML views, PDF and ePub downloads, according to the available data) and Abstracts Views on Vision4Press platform.
Data correspond to usage on the plateform after 2015. The current usage metrics is available 48-96 hours after online publication and is updated daily on week days.
Initial download of the metrics may take a while.