Fig. 9
Download original image
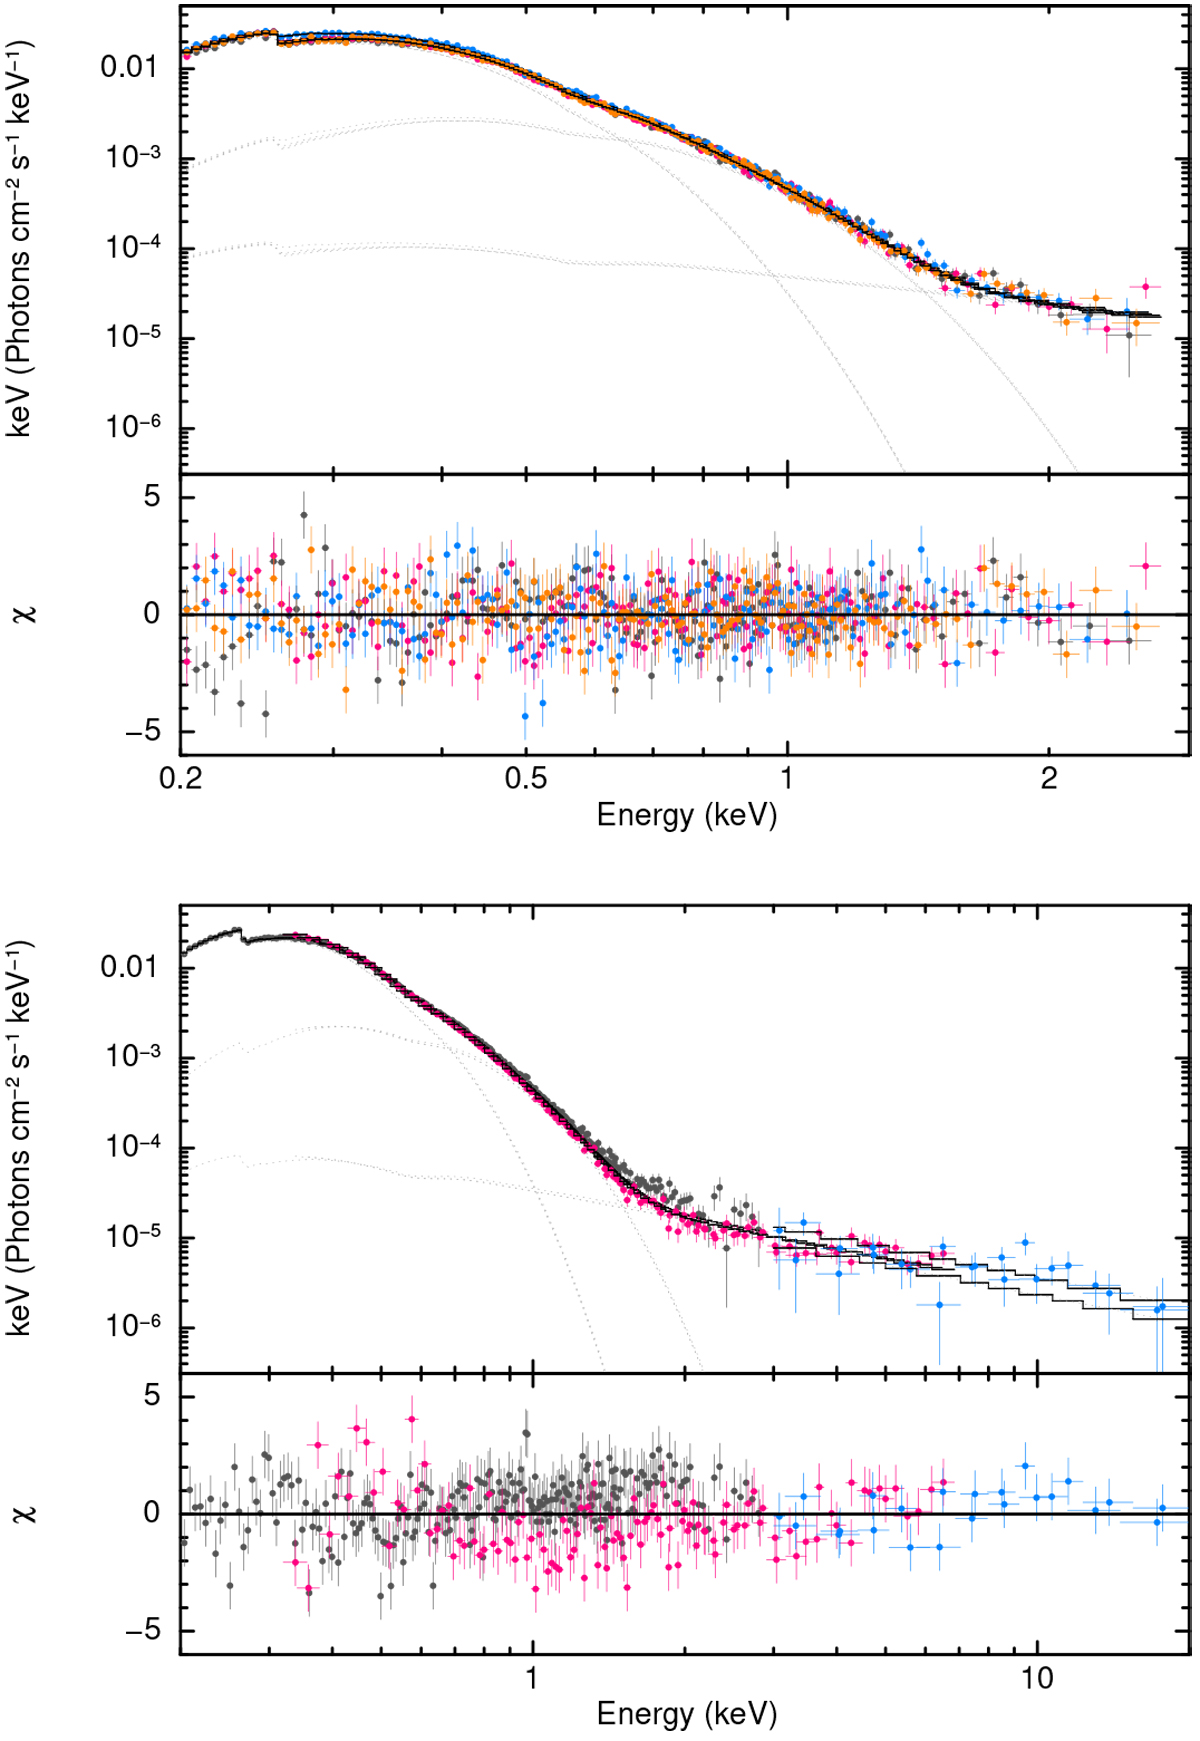
Results of the phase-averaged spectral fitting. Top: we show the eROSITA spectra of detectors 2, 3, 4, and 6 simultaneously fit by the model of Table 6 and a fixed power-law index of Γ = 1.98. Bottom: simultaneous fit of eROSITA, XMM-Newton, and NuSTAR (dark gray, magenta, and blue data points, respectively). The best-fit parameters are listed in Table 6.
Current usage metrics show cumulative count of Article Views (full-text article views including HTML views, PDF and ePub downloads, according to the available data) and Abstracts Views on Vision4Press platform.
Data correspond to usage on the plateform after 2015. The current usage metrics is available 48-96 hours after online publication and is updated daily on week days.
Initial download of the metrics may take a while.