Fig. 8
Download original image
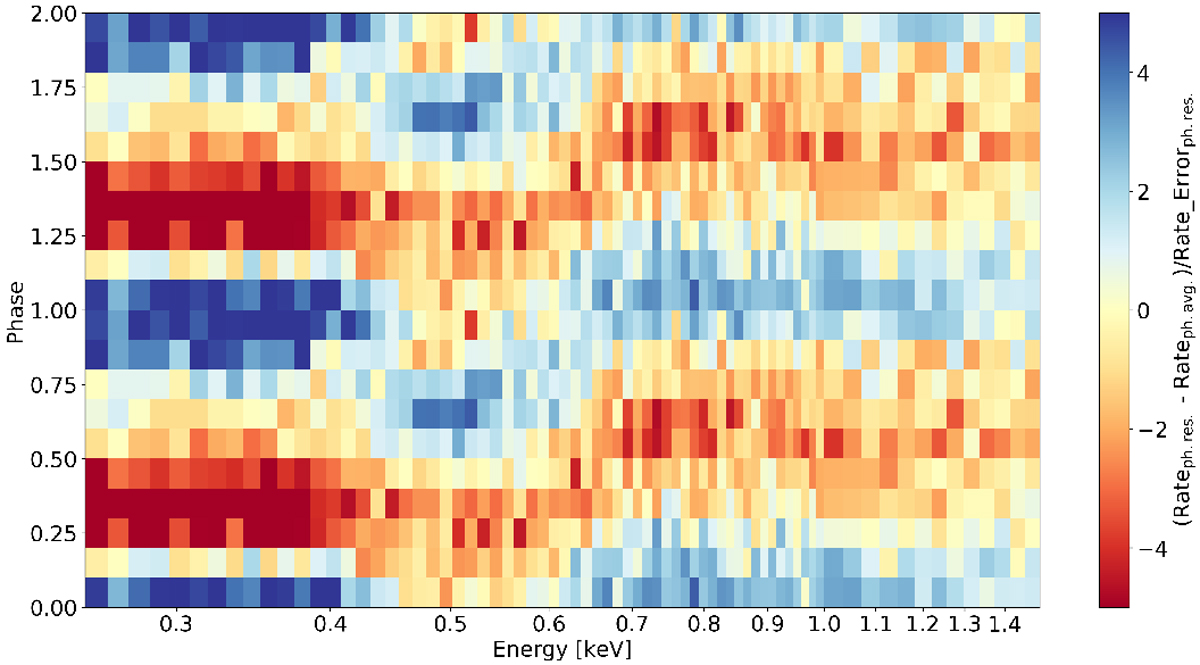
Trailed spectrogram of the eROSITA pulse profile, with phase and energy along the y– and x–axes, respectively. The mean spectrum was subtracted from the original data. Color thus indicates a positive or negative deviation from the mean. Excess values were normalized to their errors. The pulse profile is shown twice for better visibility.
Current usage metrics show cumulative count of Article Views (full-text article views including HTML views, PDF and ePub downloads, according to the available data) and Abstracts Views on Vision4Press platform.
Data correspond to usage on the plateform after 2015. The current usage metrics is available 48-96 hours after online publication and is updated daily on week days.
Initial download of the metrics may take a while.