Fig. 6
Download original image
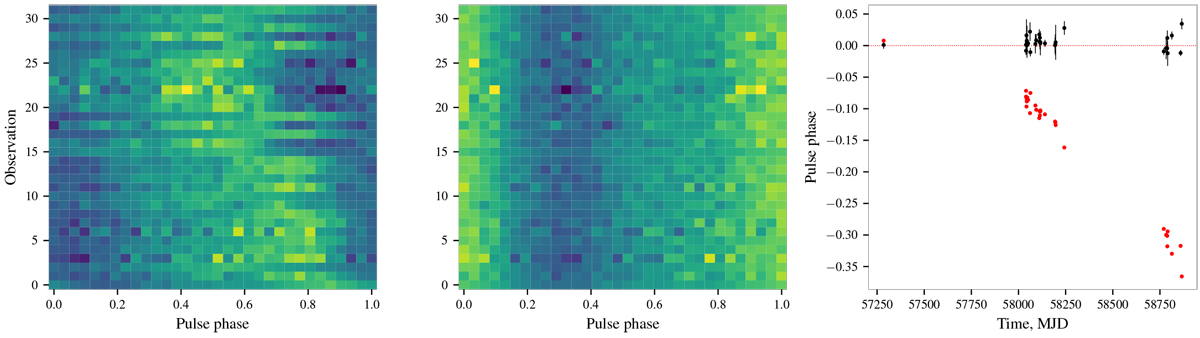
Phaseograms showing pulse proflies in 0.3–2 keV for individual data groups listed in Table C.2 folded using Johnston & Kerr (2018) (left) and the updated ephemeris (middle) obtained in this work. The phase residuals to the best-fit solution (black symbols with error bars) and for the Johnston & Kerr (2018) solution (red, zerophase corresponds to the phase of the radio peak, and errors are omitted for clarity) are also shown in the right panel.
Current usage metrics show cumulative count of Article Views (full-text article views including HTML views, PDF and ePub downloads, according to the available data) and Abstracts Views on Vision4Press platform.
Data correspond to usage on the plateform after 2015. The current usage metrics is available 48-96 hours after online publication and is updated daily on week days.
Initial download of the metrics may take a while.