Fig. 5
Download original image
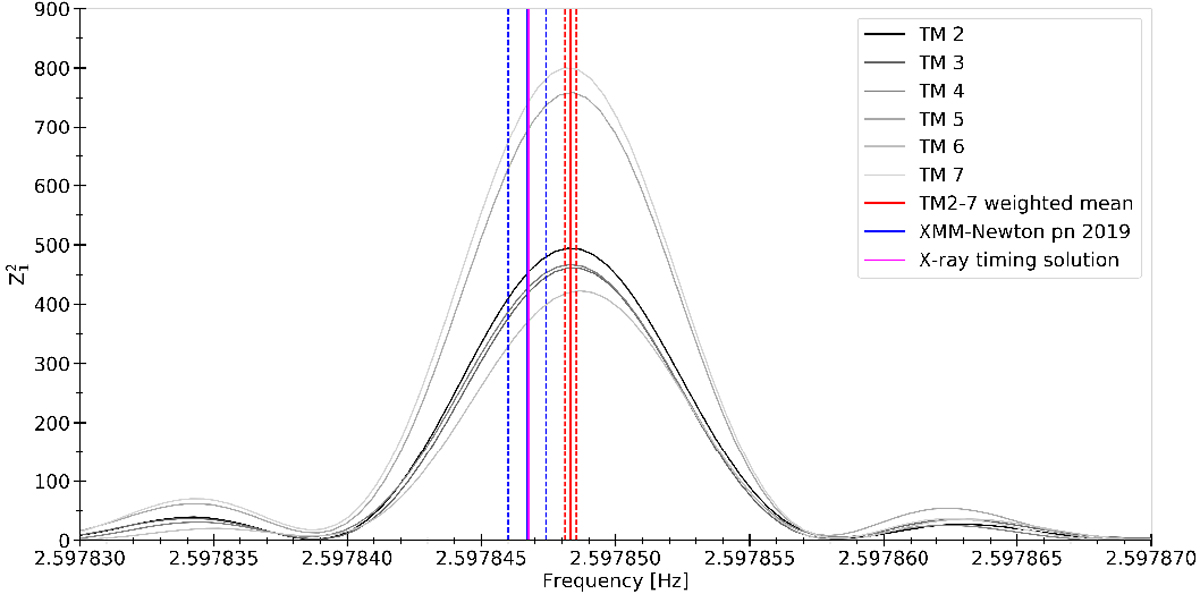
Period search of eROSITA and XMM-Newton data. ![]() statistics per eROSITA TM (identified with different gray nuances) and the most likely periods from eROSITA (vertical red line, weighted mean; the dashed lines indicate the 1σ confidence interval), the simultaneous XMM-Newton data (vertical blue lines), and the extrapolated period using the ephemeris given by Lower et al. (2020) (magenta).
statistics per eROSITA TM (identified with different gray nuances) and the most likely periods from eROSITA (vertical red line, weighted mean; the dashed lines indicate the 1σ confidence interval), the simultaneous XMM-Newton data (vertical blue lines), and the extrapolated period using the ephemeris given by Lower et al. (2020) (magenta).
Current usage metrics show cumulative count of Article Views (full-text article views including HTML views, PDF and ePub downloads, according to the available data) and Abstracts Views on Vision4Press platform.
Data correspond to usage on the plateform after 2015. The current usage metrics is available 48-96 hours after online publication and is updated daily on week days.
Initial download of the metrics may take a while.