Fig. 3
Download original image
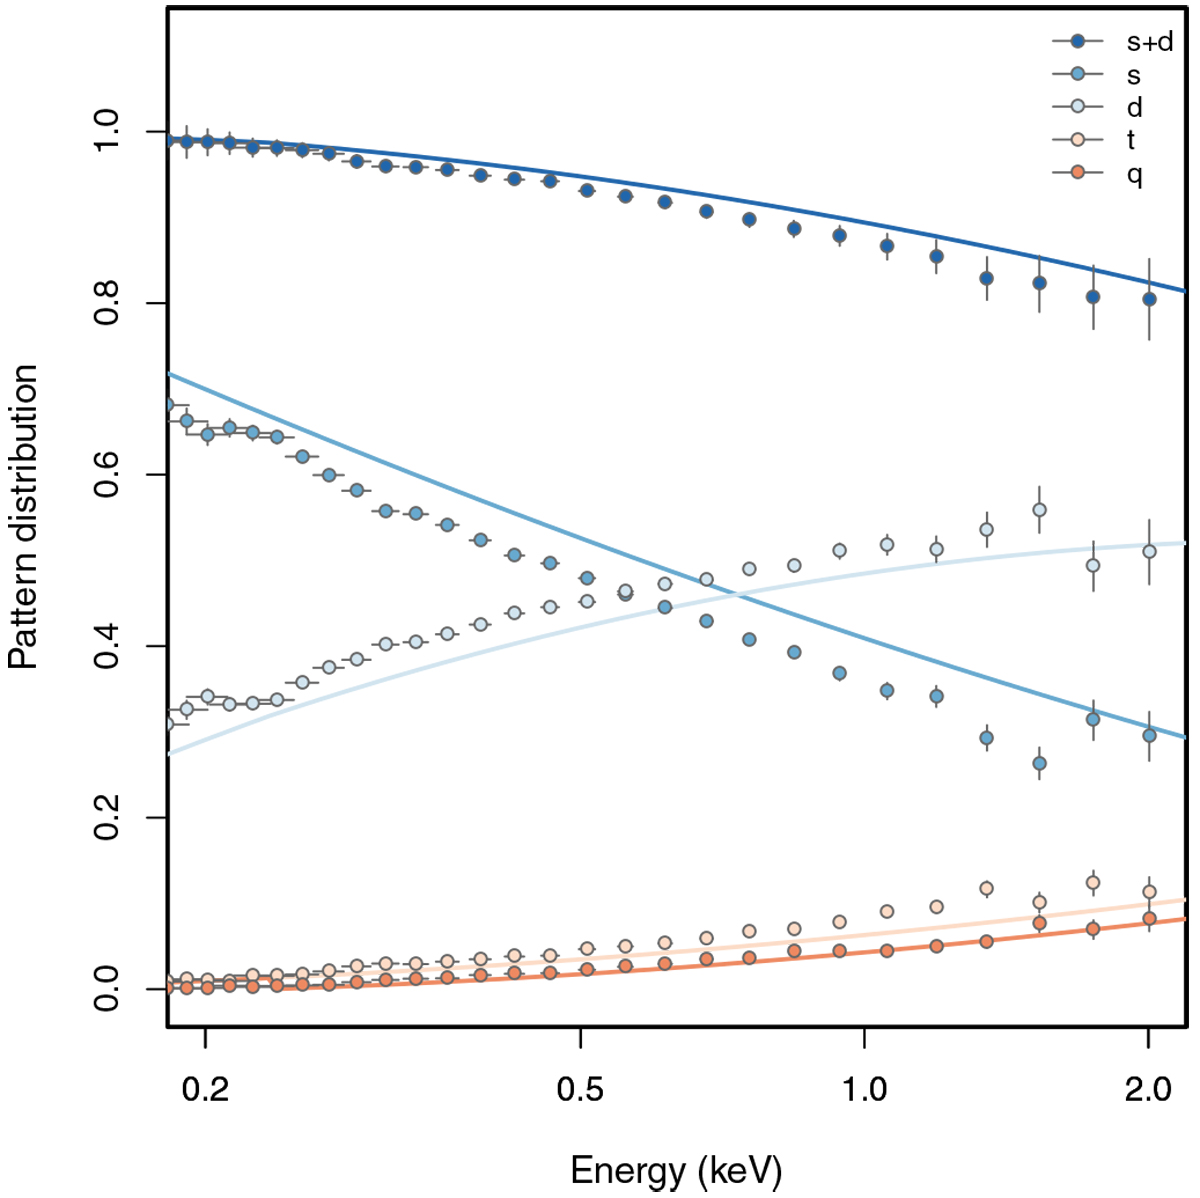
Distribution of photon pattern fractions as a function of energy. The observed fractions of singles (s), doubles (d), singles and doubles (s + d), triples (t), and quadruples (q) are shown as data points for the TM8 detector combination. Solid lines show the expected (theoretical) pattern distribution in the 0.2–2 keV energy band.
Current usage metrics show cumulative count of Article Views (full-text article views including HTML views, PDF and ePub downloads, according to the available data) and Abstracts Views on Vision4Press platform.
Data correspond to usage on the plateform after 2015. The current usage metrics is available 48-96 hours after online publication and is updated daily on week days.
Initial download of the metrics may take a while.