Fig. 9
Download original image
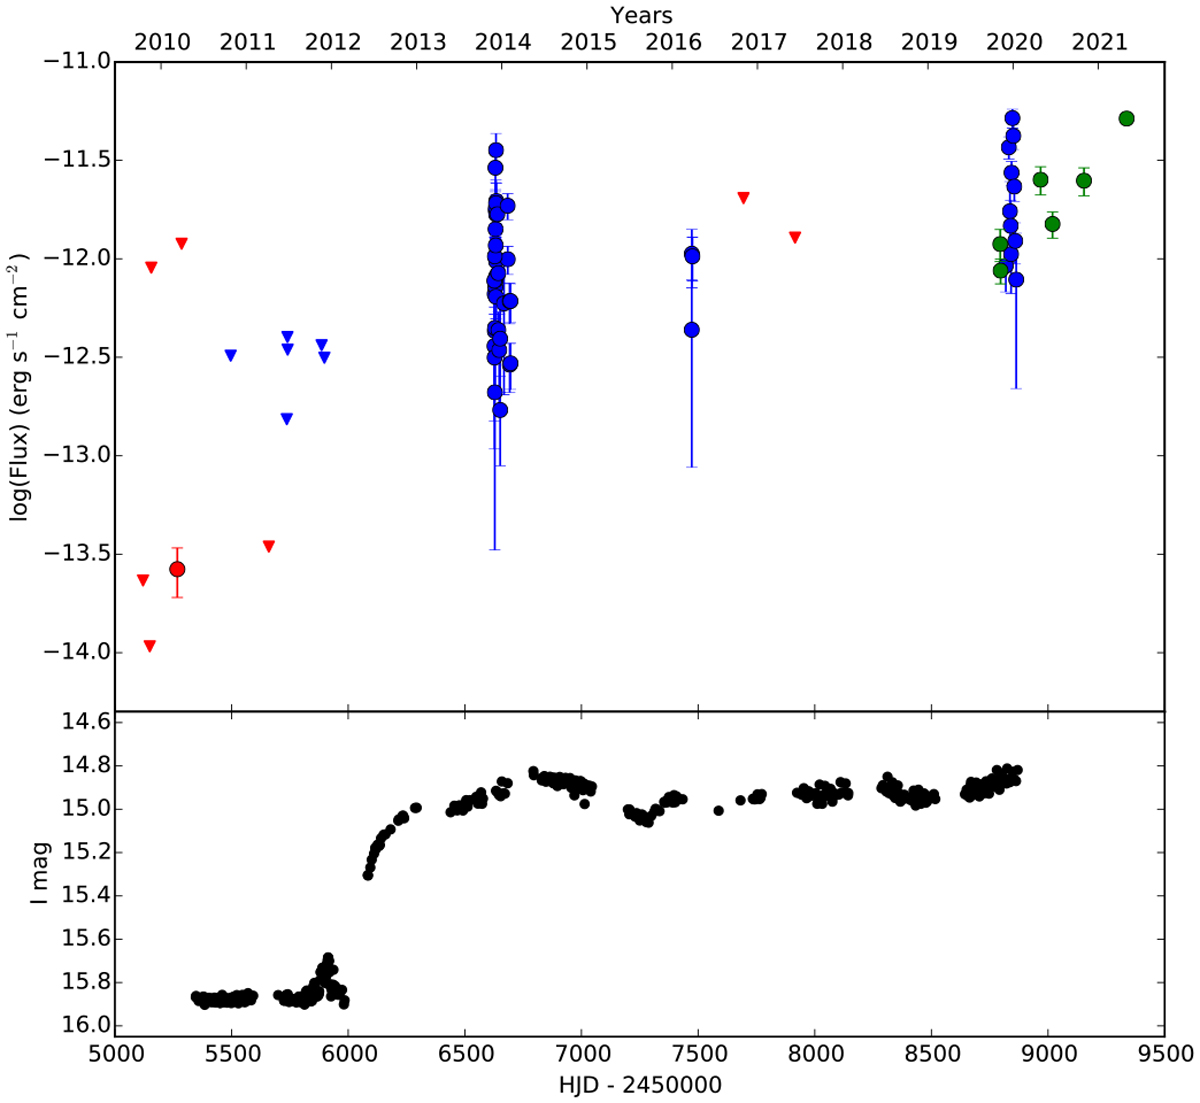
Long-term X-ray light curve of SXP164 (top) during the OGLE monitoring (bottom). Dots represent measured flux, while upper limits are shown as triangles. XMM-Newton (pointed+slew), Swift and eROSITA fluxes are shown in red, blue, and green, respectively. Flux values before 2019 are derived using the ULS.
Current usage metrics show cumulative count of Article Views (full-text article views including HTML views, PDF and ePub downloads, according to the available data) and Abstracts Views on Vision4Press platform.
Data correspond to usage on the plateform after 2015. The current usage metrics is available 48-96 hours after online publication and is updated daily on week days.
Initial download of the metrics may take a while.