Fig. 3
Download original image
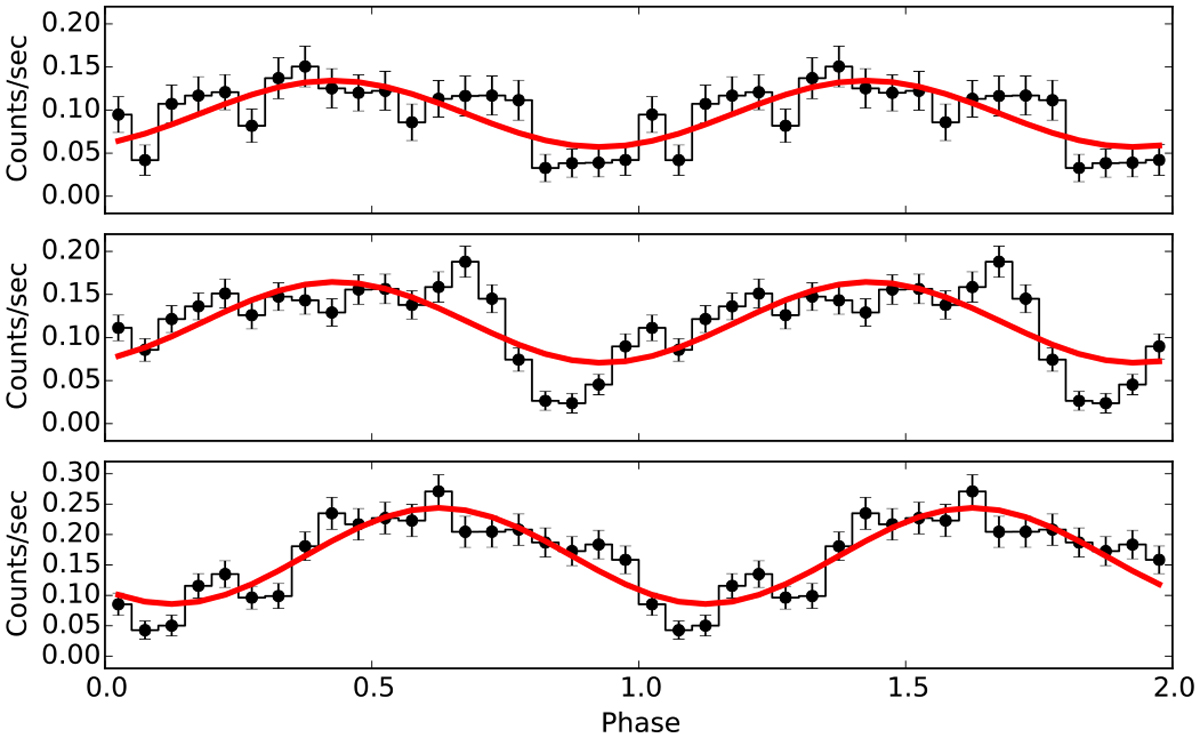
Folded eROSITA light curves of SXP 164 during ObsID 700 001 (top), 700003 (middle), and 710 000 (bottom), extracted in the 0.2–5.0 keV band. The best-fit sine function is overlaid. Phase 0 corresponds to the start of the first observation. The light curves from the first two observations are folded with the common period (163.89 s).
Current usage metrics show cumulative count of Article Views (full-text article views including HTML views, PDF and ePub downloads, according to the available data) and Abstracts Views on Vision4Press platform.
Data correspond to usage on the plateform after 2015. The current usage metrics is available 48-96 hours after online publication and is updated daily on week days.
Initial download of the metrics may take a while.