Fig. 1
Download original image
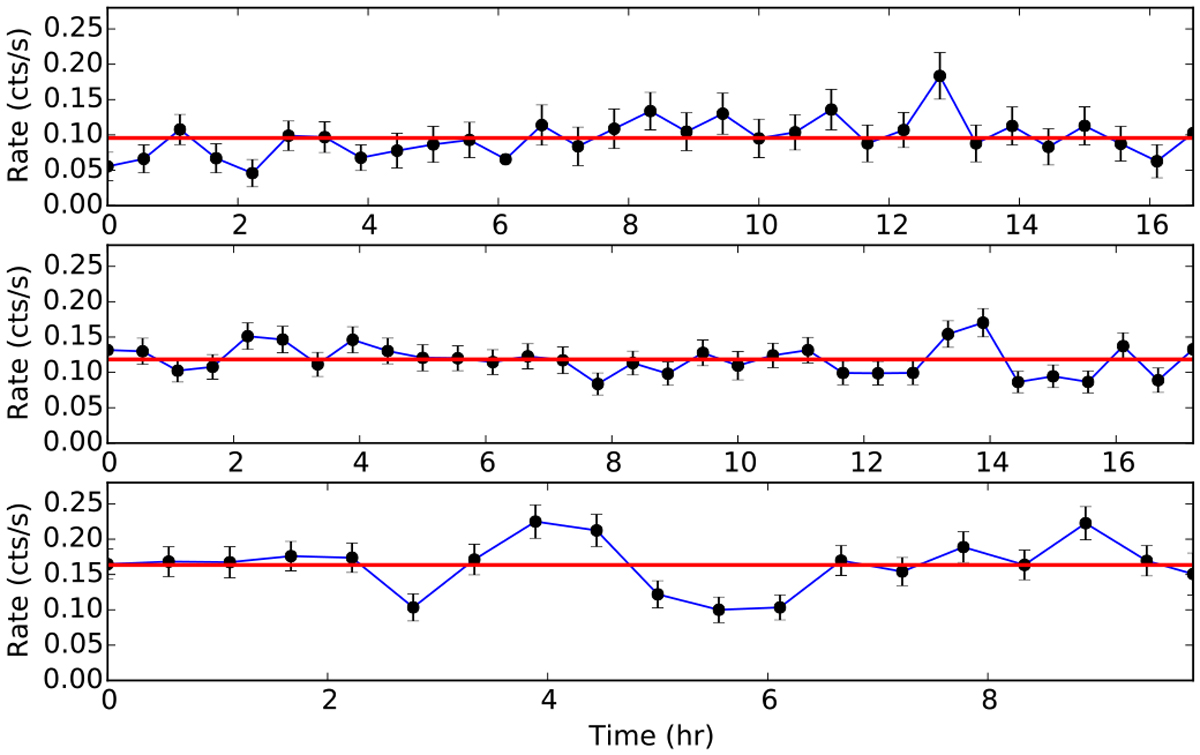
eROSITA light curve of SXP 164, during ObsID 700 001 (top), 700 003 (middle) and 710 000 (bottom), rebinned at 2000 s, extracted in the 0.2–5.0 keV band. The red lines indicate the mean values of 0.10, 0.12, and 0.16 cts s−1 for the three respective observations.
Current usage metrics show cumulative count of Article Views (full-text article views including HTML views, PDF and ePub downloads, according to the available data) and Abstracts Views on Vision4Press platform.
Data correspond to usage on the plateform after 2015. The current usage metrics is available 48-96 hours after online publication and is updated daily on week days.
Initial download of the metrics may take a while.