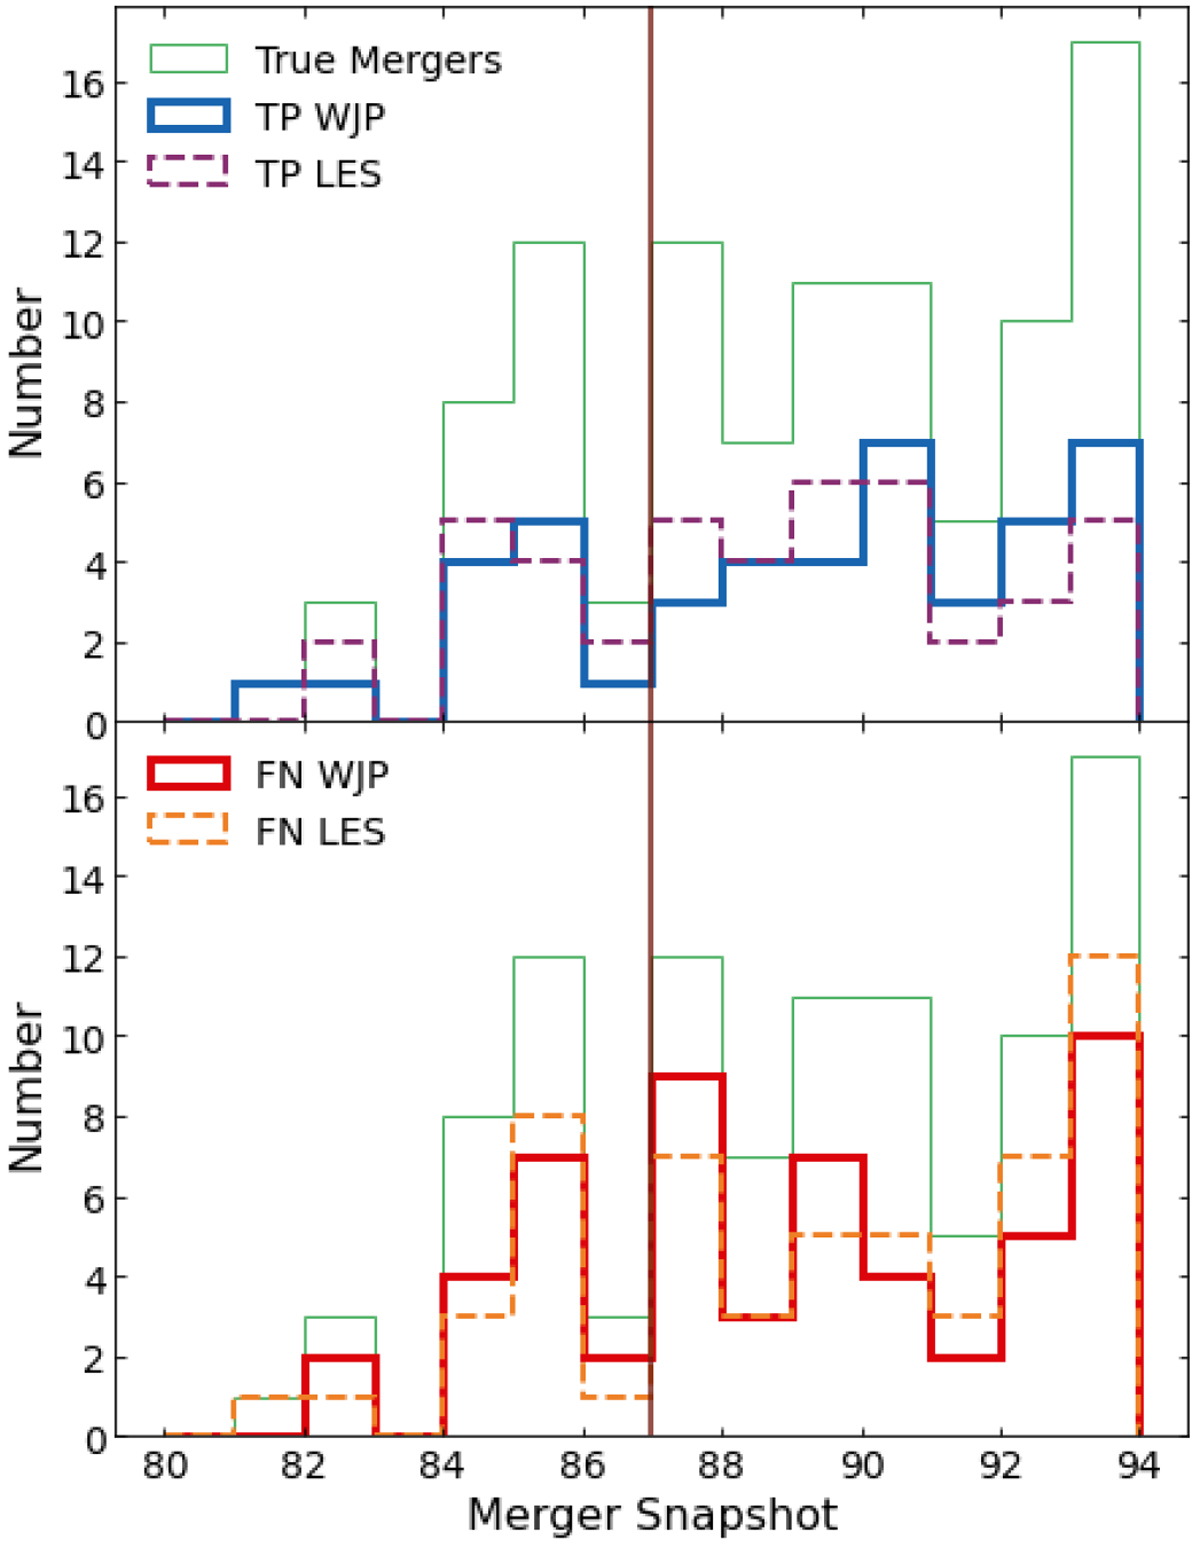
Fig. B.1
Download original image
Plot of correctly and incorrectly identified images of simulated mergers as a function of snapshot when the merger occurred. The blue and red lines indicate the TP and FN, respectively, classified by WJP while the purple and orange dashed lines indicate the TP and FN, respectively, classified by LES. The Green line indicates the total number of mergers used from Illustris TNG while the vertical brown line indicates the snapshot of observation (87, z = 0.15).
Current usage metrics show cumulative count of Article Views (full-text article views including HTML views, PDF and ePub downloads, according to the available data) and Abstracts Views on Vision4Press platform.
Data correspond to usage on the plateform after 2015. The current usage metrics is available 48-96 hours after online publication and is updated daily on week days.
Initial download of the metrics may take a while.