Fig. 15
Download original image
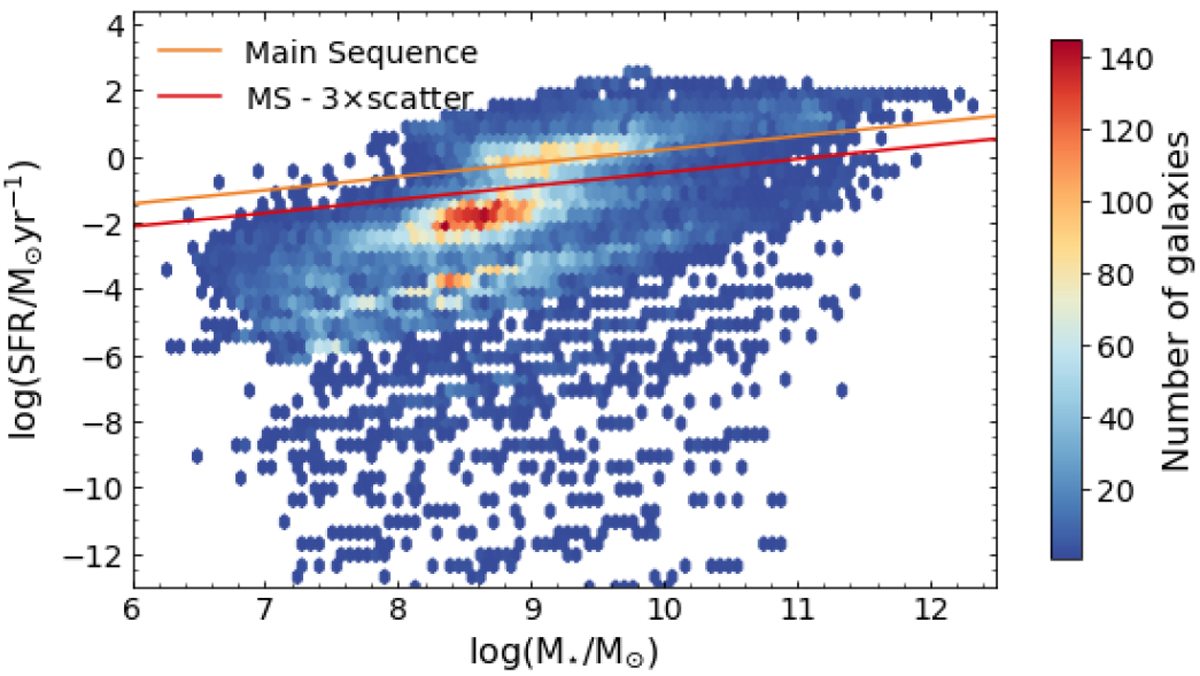
M★-SFR plane for the galaxies classified by the neural networks. The number of galaxies in each M★-SFR bin is from low in blue to high in red. The orange line indicates the Pearson et al. (2018) main-sequence at z = 0.24 while the red line indicated three times the scatter below the main-sequence. Galaxies are classified as star-forming if they lie above the red line.
Current usage metrics show cumulative count of Article Views (full-text article views including HTML views, PDF and ePub downloads, according to the available data) and Abstracts Views on Vision4Press platform.
Data correspond to usage on the plateform after 2015. The current usage metrics is available 48-96 hours after online publication and is updated daily on week days.
Initial download of the metrics may take a while.