Fig. 7.
Download original image
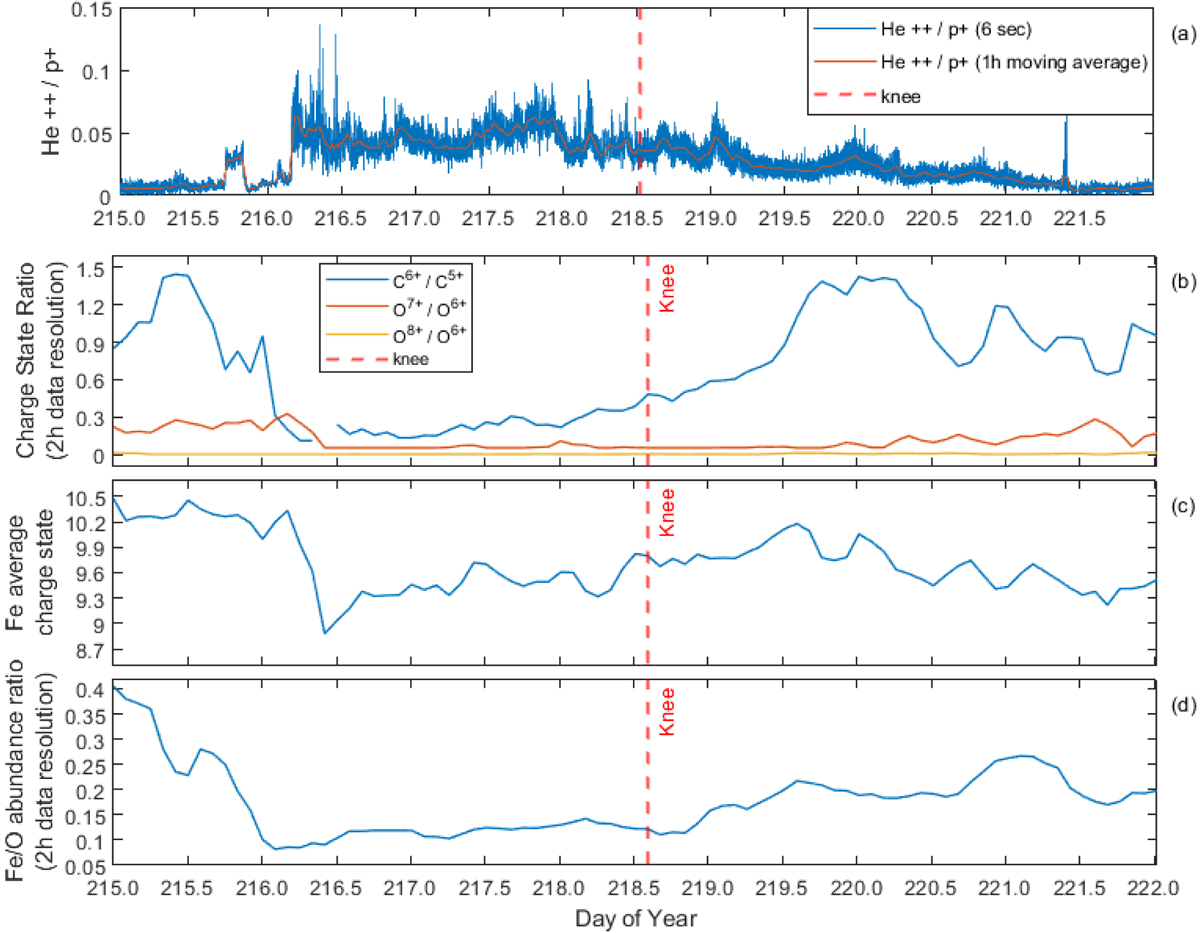
Temporal profiles of ion compositions during the August 2017 stream. Panel a: alpha particle to proton ratio He++/p+ at a time resolution of 6 s (in blue) and its hourly moving average (in red). Panel b: charge-state ratio at a time resolution of 2 h of C6+/C5+ in blue, O7+/O6+ in red, and O8+/O6+ in yellow. Panel c: iron average charge state at a time resolution of 2 h. Panel d: iron to oxygen abundance ratio at a time resolution of 2 h. The dashed red line denotes the velocity knee between the fast-wind region and the rarefaction region.
Current usage metrics show cumulative count of Article Views (full-text article views including HTML views, PDF and ePub downloads, according to the available data) and Abstracts Views on Vision4Press platform.
Data correspond to usage on the plateform after 2015. The current usage metrics is available 48-96 hours after online publication and is updated daily on week days.
Initial download of the metrics may take a while.