Fig. 5.
Download original image
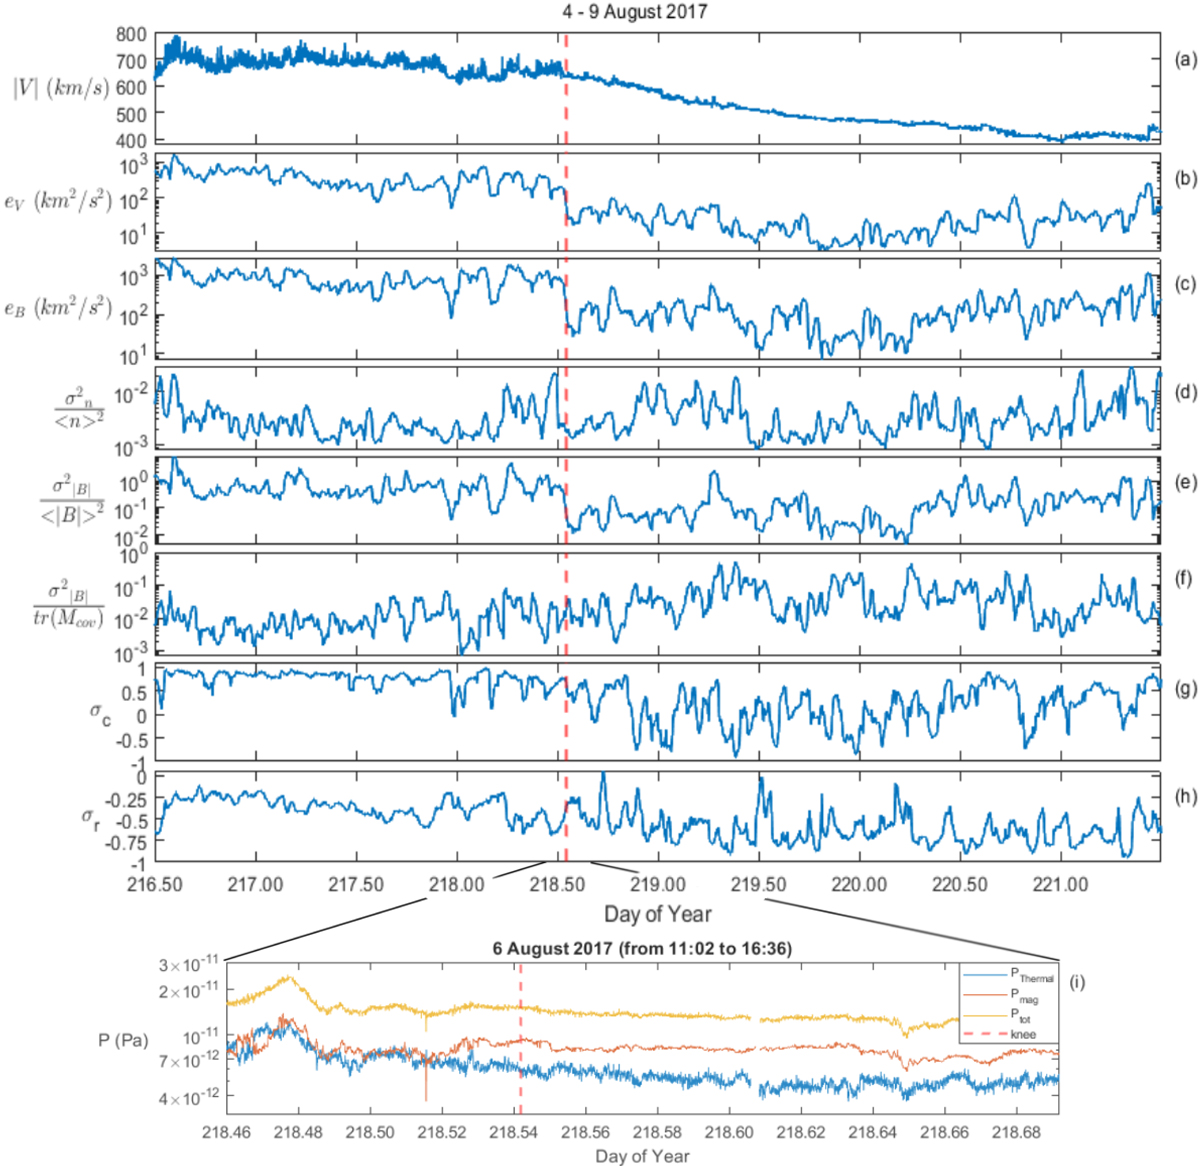
Fast-wind region and rarefaction region of the August 2017 stream. From top to bottom: solar wind speed at a time resolution of 6 s (panel a), values computed in a one-hour moving window of the kinetic energy in semi-logarithmic scale (panel b), magnetic energy in semilogarithmic scale (panel c), density compressibility in semilogarithmic scale (panel d), compressibility of the magnetic field magnitude in semilogarithmic scale (panel e), compressibility of magnetic field fluctuations in semilogarithmic scale (panel f), normalized cross-helicity (panel g), and normalized residual energy (panel h). Bottom panel (panel i) shows an enlargement of the total pressure (yellow), magnetic pressure (orange), and thermal pressure (blue) trend in a small region of a few hours close to the velocity knee. The knee is represented by the dashed red line in each panel.
Current usage metrics show cumulative count of Article Views (full-text article views including HTML views, PDF and ePub downloads, according to the available data) and Abstracts Views on Vision4Press platform.
Data correspond to usage on the plateform after 2015. The current usage metrics is available 48-96 hours after online publication and is updated daily on week days.
Initial download of the metrics may take a while.