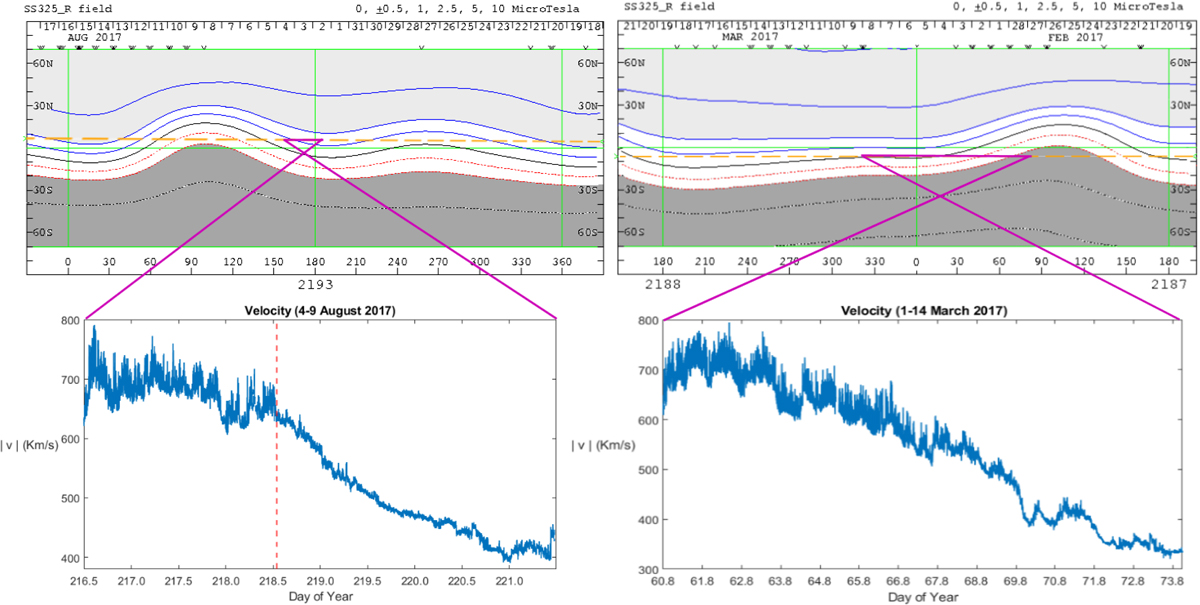
Fig. 4.
Download original image
Source surface synoptic charts at 3.25Rs for July–August 2017 on the left side and February–March 2017 on the right side (source: Wilcox Solar Observatory). The level curves indicate values of a constant magnetic field (at 3.25Rs), the black line represents the heliomagnetic equator (current sheet), the two different shades of gray indicate the magnetic field polarity: dark gray and red lines correspond to negative polarity, and light gray and blue lines correspond to positive polarity. The dashed orange line represents the Earth trajectory projected to the solar surface at 3.25Rs. The different purple lines correspond to the periods of the streams. Bottom two panels: velocity profiles of the August 2017 stream (left) and of the March 2017 stream (right).
Current usage metrics show cumulative count of Article Views (full-text article views including HTML views, PDF and ePub downloads, according to the available data) and Abstracts Views on Vision4Press platform.
Data correspond to usage on the plateform after 2015. The current usage metrics is available 48-96 hours after online publication and is updated daily on week days.
Initial download of the metrics may take a while.