Open Access
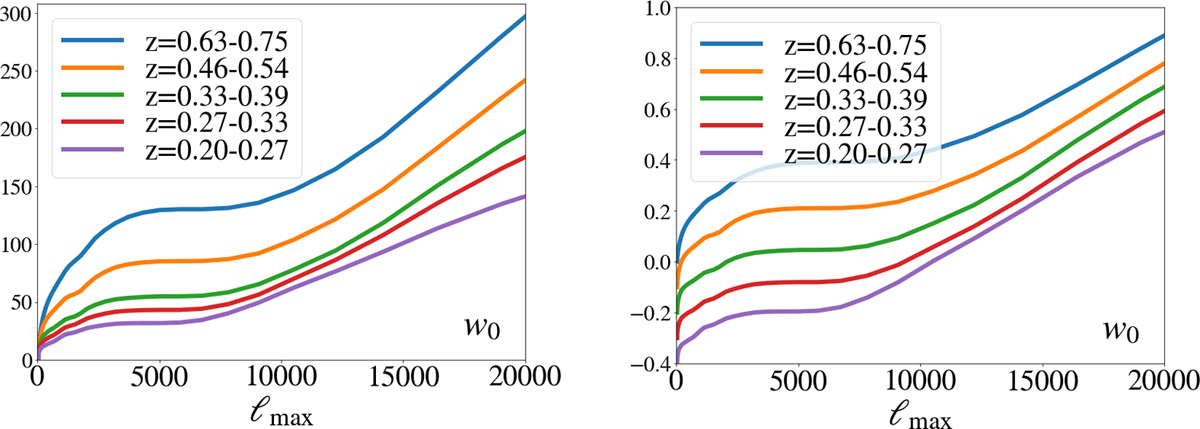
Fig. 6.
Download original image
Left: Fisher information on w0, ![]() , as a function of ℓmax for most redshift bins of SKA2, where the bins were selected to maintain the clarity of the plot. Right: same but all curves are rescaled to [0,1] and an offset is added for readability.
, as a function of ℓmax for most redshift bins of SKA2, where the bins were selected to maintain the clarity of the plot. Right: same but all curves are rescaled to [0,1] and an offset is added for readability.
Current usage metrics show cumulative count of Article Views (full-text article views including HTML views, PDF and ePub downloads, according to the available data) and Abstracts Views on Vision4Press platform.
Data correspond to usage on the plateform after 2015. The current usage metrics is available 48-96 hours after online publication and is updated daily on week days.
Initial download of the metrics may take a while.