Fig. 10.
Download original image
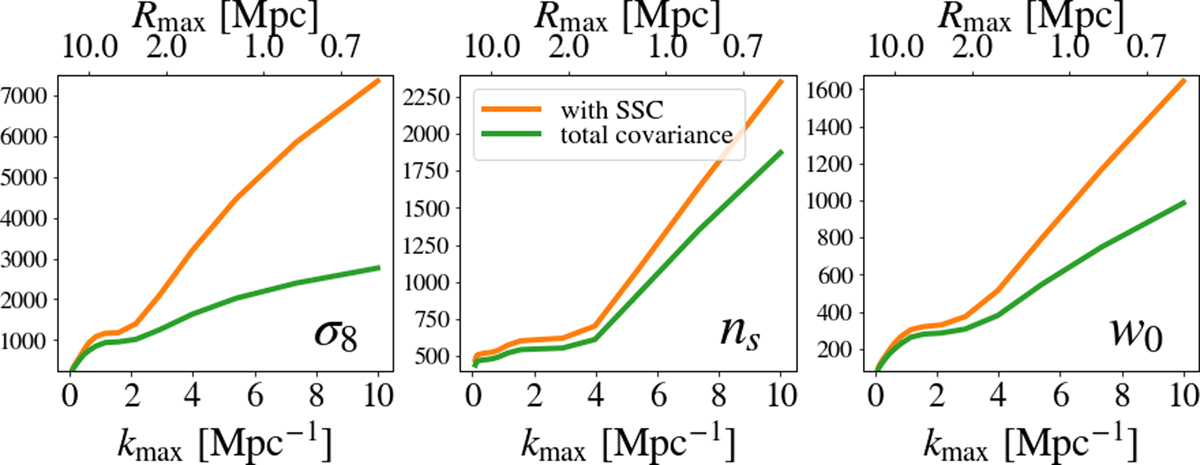
Fisher information on σ8, nS, and w0 as a function of the physical cut kmax, for SKA2 galaxies summed over all redshift bins. The green lower curve shows the power spectrum information with the total covariance, while the orange upper curve uses only the Gaussian + SSC as an estimate of the fundamental limit of the information in the galaxy density field.
Current usage metrics show cumulative count of Article Views (full-text article views including HTML views, PDF and ePub downloads, according to the available data) and Abstracts Views on Vision4Press platform.
Data correspond to usage on the plateform after 2015. The current usage metrics is available 48-96 hours after online publication and is updated daily on week days.
Initial download of the metrics may take a while.