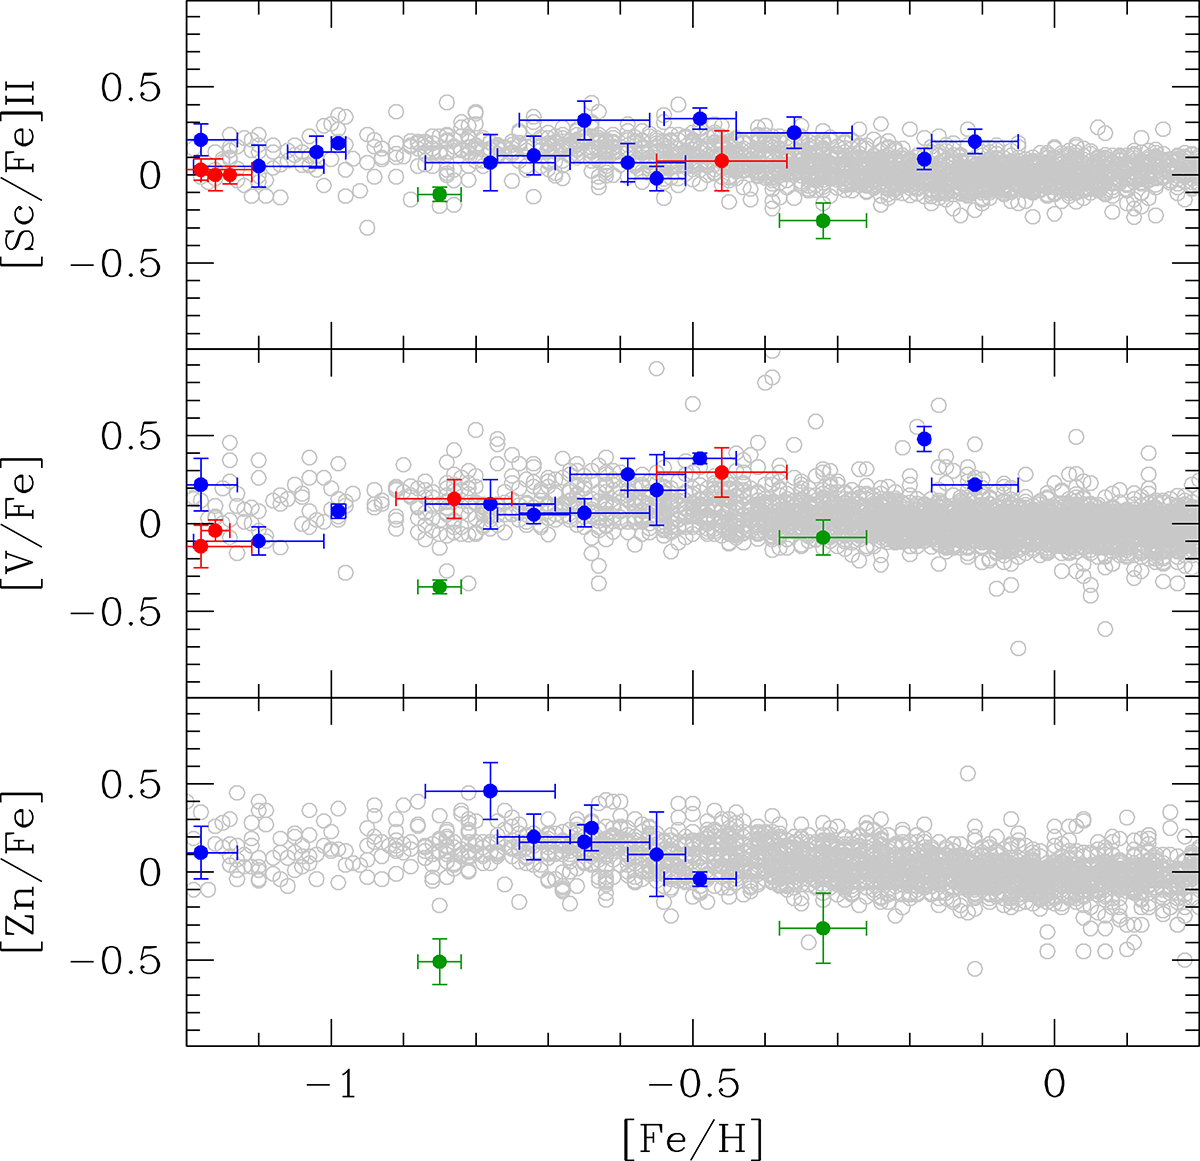
Fig. 4.
Download original image
Mean abundance ratios [Sc/Fe], [V/Fe], and [Zn/Fe] for metal-rich GCs in the literature (blue filled circles are for GCs of the main progenitor, either M-B or M-D; green circles are for Sagittarius GCs, and red circles are for all other accreted GCs of the L-E, H-E, H99, GSE, and SEQ groups) compared to the field star distributions. Abundances for GCs are from Carretta (2015), Carretta et al. (2004, 2011), Cohen (2004), Crestani et al. (2019), Feltzing et al. (2009), Gratton et al. (2006, 2007), Ivans et al. (1999), Massari et al. (2017), Monaco et al. (2018), Muñoz et al. (2017, 2018, 2020), Mura-Guzmán et al. (2018), O’Connell et al. (2011), Puls et al. (2018), Ramírez & Cohen (2002), Sakari et al. (2011), Sbordone et al. (2007), and Yong et al. (2014).
Current usage metrics show cumulative count of Article Views (full-text article views including HTML views, PDF and ePub downloads, according to the available data) and Abstracts Views on Vision4Press platform.
Data correspond to usage on the plateform after 2015. The current usage metrics is available 48-96 hours after online publication and is updated daily on week days.
Initial download of the metrics may take a while.