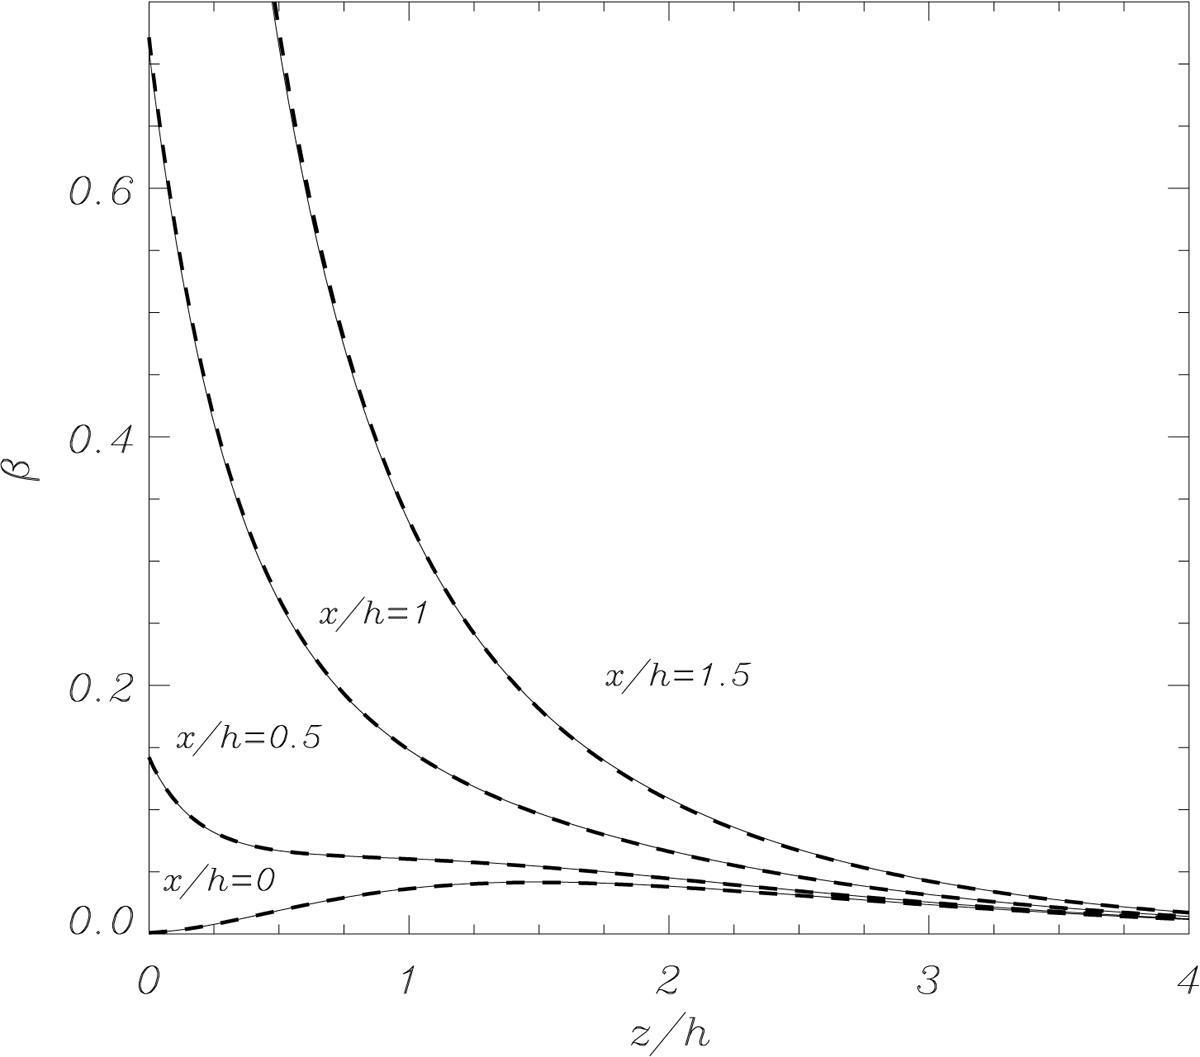
Fig. 8.
Download original image
Plasma-β as a function of height for the CH model with β0 = 0.004 at different values of x (see the labels in the plot). The same parameters as in Fig. 7 are used. The thin continuous lines correspond to the results based on the semi-analytical approach, and the thick dashed lines represent the purely numerical results calculated using the code PDE2D described in Sect. 4.3. The agreement between the semi-analytical and the numerical curves is quite significant.
Current usage metrics show cumulative count of Article Views (full-text article views including HTML views, PDF and ePub downloads, according to the available data) and Abstracts Views on Vision4Press platform.
Data correspond to usage on the plateform after 2015. The current usage metrics is available 48-96 hours after online publication and is updated daily on week days.
Initial download of the metrics may take a while.