Free Access
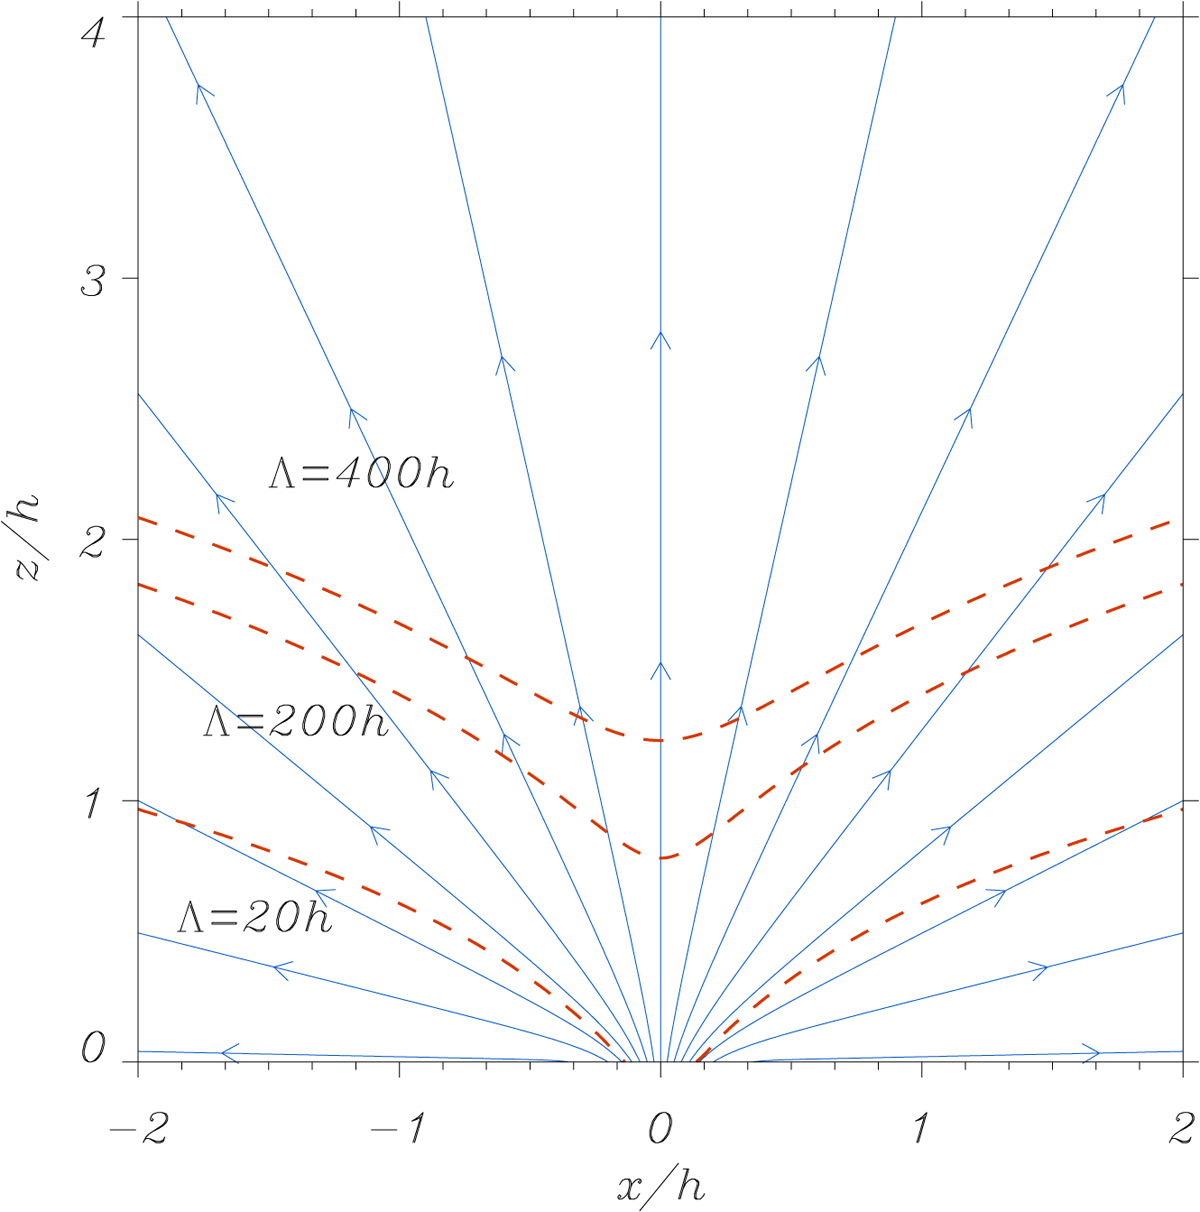
Fig. 13.
Download original image
Example of the location of the boundary, dashed red lines, that separate regions in which energy balance is allowed (below these lines) from regions in which it is not permitted (above the lines). In this case, the temperature increases with height (Λ > 0). The magnetic field is also displayed with blue lines.
Current usage metrics show cumulative count of Article Views (full-text article views including HTML views, PDF and ePub downloads, according to the available data) and Abstracts Views on Vision4Press platform.
Data correspond to usage on the plateform after 2015. The current usage metrics is available 48-96 hours after online publication and is updated daily on week days.
Initial download of the metrics may take a while.