Fig. 1.
Download original image
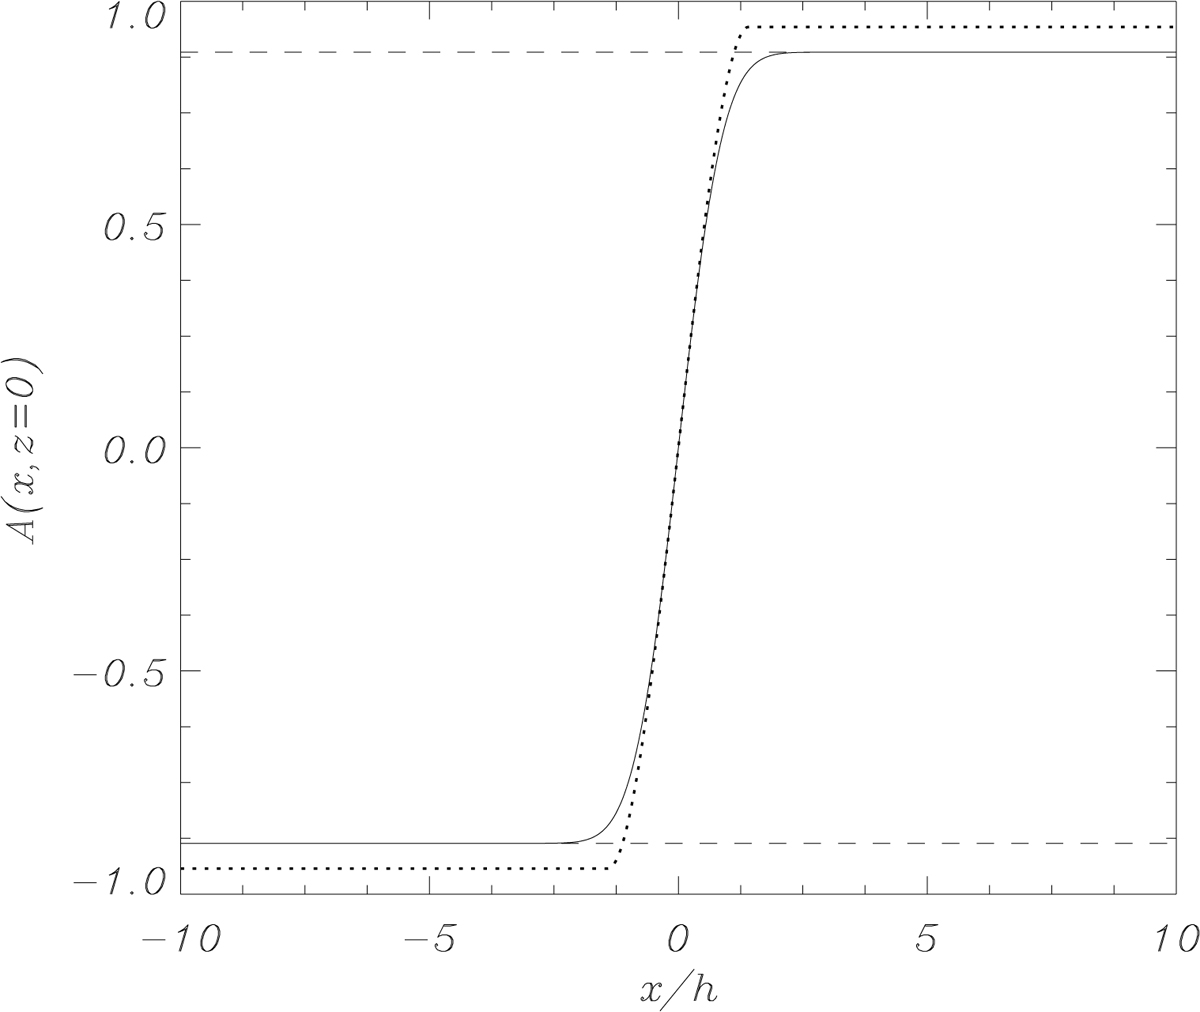
Flux function as a function of the horizontal position at z = 0. The continuous line corresponds to the Gaussian profile, and the dotted line shows the parabolic profile. The horizontal dashed lines represent the constant values that the Gaussian profile tends to asymptotically. In this plot, w0/h = 1, and C = 0 for the Gaussian profile, while x0/h = 1 for the parabolic profile.
Current usage metrics show cumulative count of Article Views (full-text article views including HTML views, PDF and ePub downloads, according to the available data) and Abstracts Views on Vision4Press platform.
Data correspond to usage on the plateform after 2015. The current usage metrics is available 48-96 hours after online publication and is updated daily on week days.
Initial download of the metrics may take a while.