Open Access
Fig. 5
Download original image
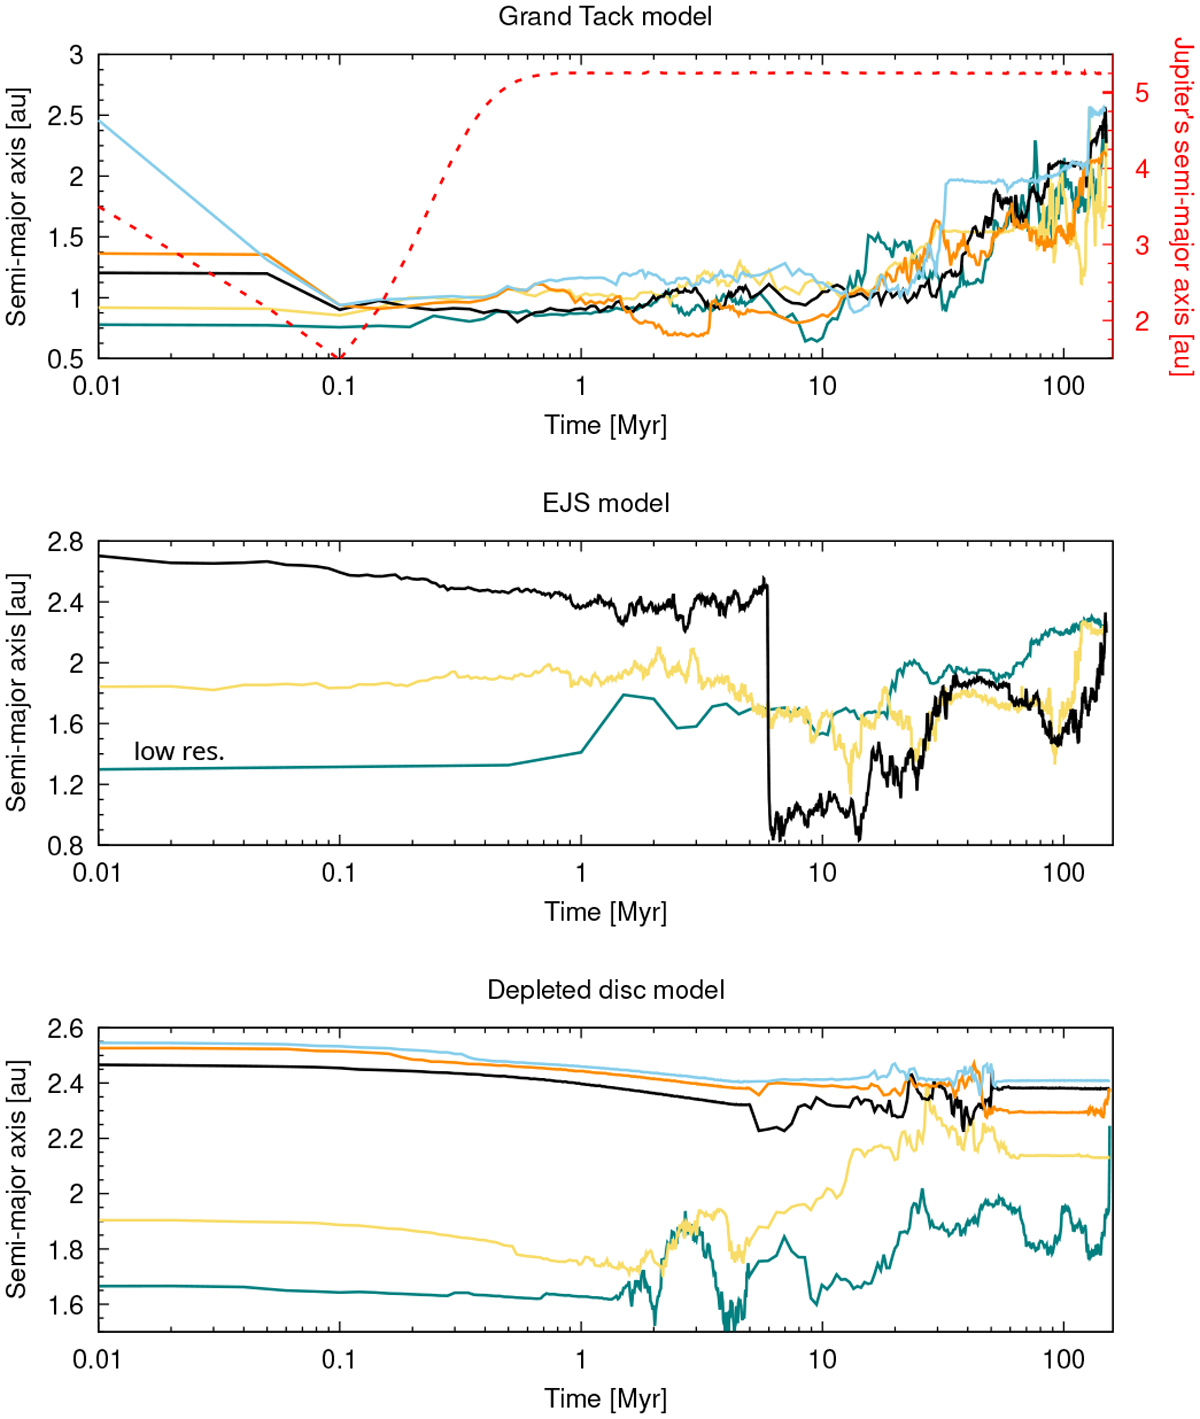
Evolution of the semi-major axes over time for all the Vesta analogues from each dynamical model’s best Solar System analogue. For the Grand Tack model (top panel) we also plot the evolution of Jupiter’s semi-major axis with red dashed line.
Current usage metrics show cumulative count of Article Views (full-text article views including HTML views, PDF and ePub downloads, according to the available data) and Abstracts Views on Vision4Press platform.
Data correspond to usage on the plateform after 2015. The current usage metrics is available 48-96 hours after online publication and is updated daily on week days.
Initial download of the metrics may take a while.