Fig. 4.
Download original image
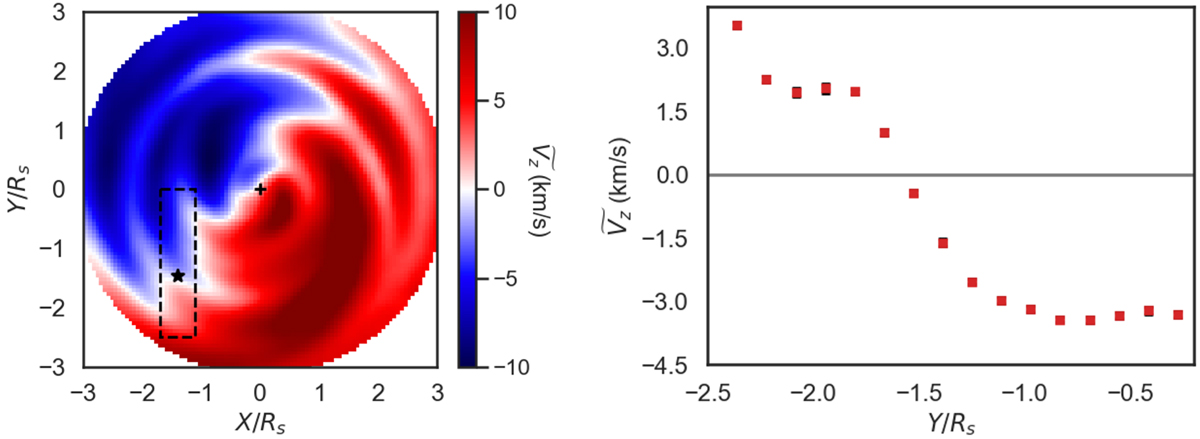
Median Vz distribution of disk stars: (a) projected in the X − Y plane from the N-body simulation of a galactic disk perturbed by a satellite comparable in mass to the Sagittarius dwarf galaxy; (b) from the dashed rectangular region of the left plot, with the Sun placed at the interface of underdense (blue) and overdense (red) region in velocity space (as seen from the velocity maps in Fig. 2), showing a maximum amplitude close to 4 km s−1, comparable to that of the OB stars as seen from Fig. 2.
Current usage metrics show cumulative count of Article Views (full-text article views including HTML views, PDF and ePub downloads, according to the available data) and Abstracts Views on Vision4Press platform.
Data correspond to usage on the plateform after 2015. The current usage metrics is available 48-96 hours after online publication and is updated daily on week days.
Initial download of the metrics may take a while.