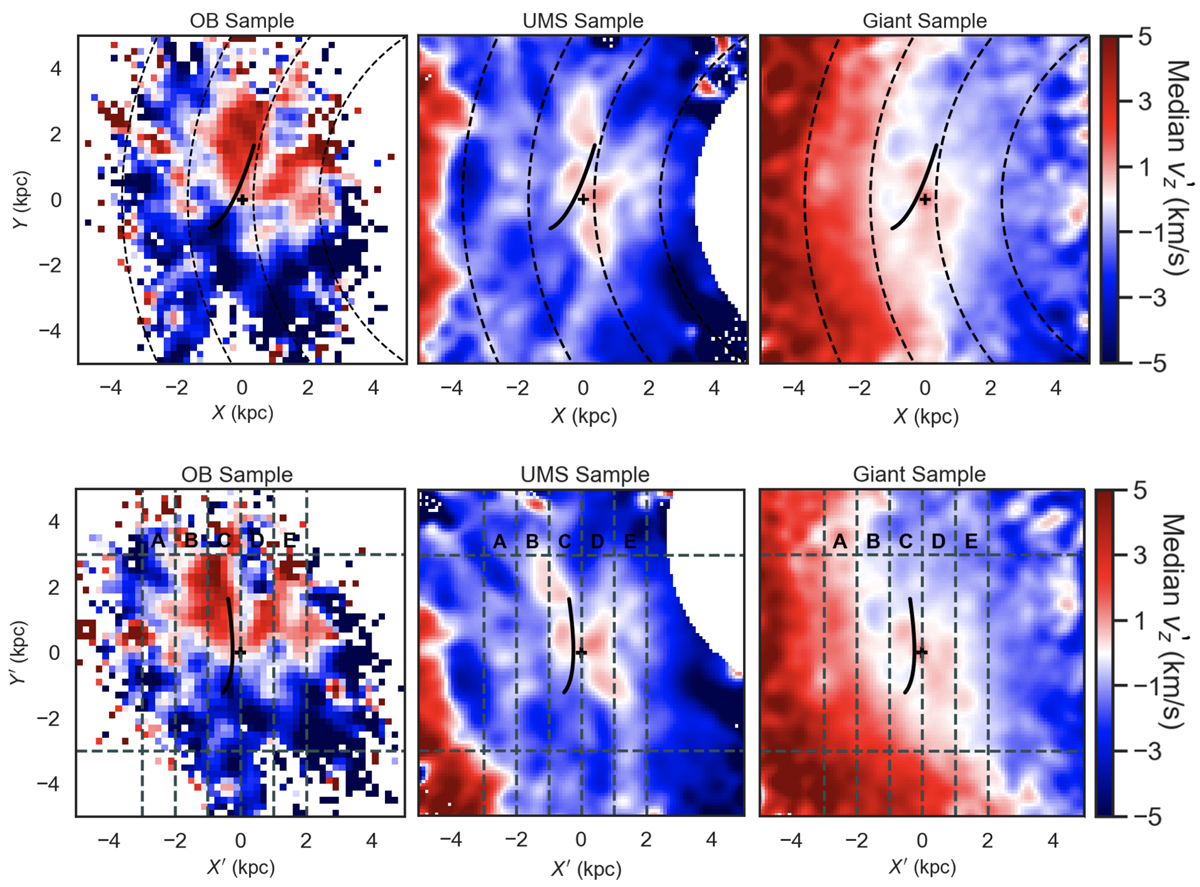
Fig. 2.
Download original image
Vertical velocity maps of our samples showing a perturbation that extends beyond the RW (see text for details). Top row: cross at the centre shows the position of the sun, the black curve is the RW and black dashed curves from right to left corresponds to different Galactocentric radii from 6 to 12 kpc. Bottom row: rotated coordinate system divided into five panels with panel C containing the RW.
Current usage metrics show cumulative count of Article Views (full-text article views including HTML views, PDF and ePub downloads, according to the available data) and Abstracts Views on Vision4Press platform.
Data correspond to usage on the plateform after 2015. The current usage metrics is available 48-96 hours after online publication and is updated daily on week days.
Initial download of the metrics may take a while.