Fig. 5.
Download original image
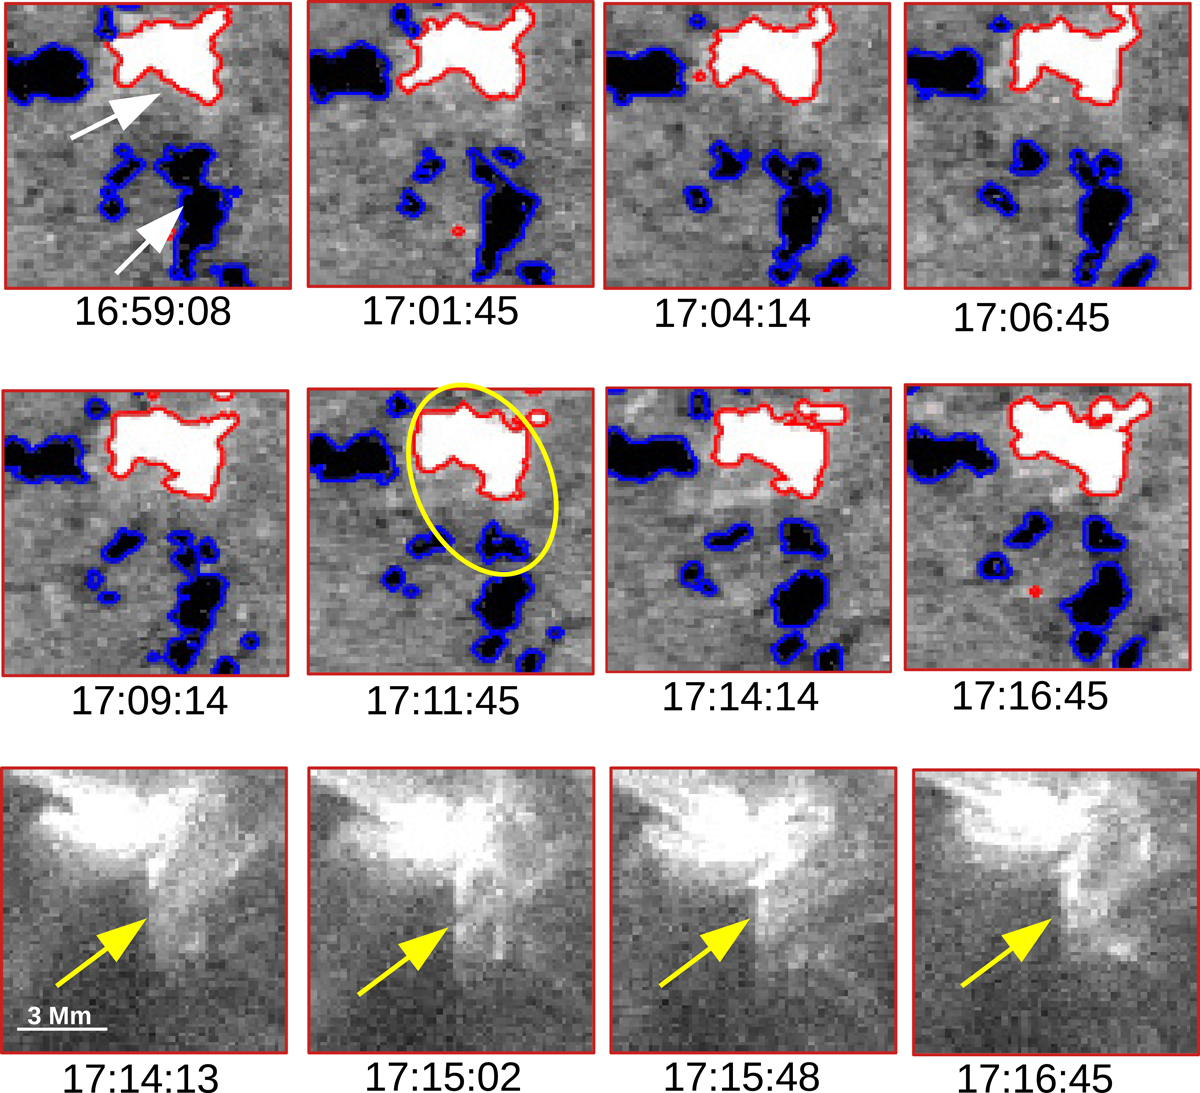
SO/PHI magnetic field distribution below a campfire event of Category Ib. The main footpoints of the event are indicated by white arrows in the first image in the first row. The yellow ellipse at 17:11:45 UT encloses the smaller feature splitting from the main negative polarity footpoint and approaching the large positive polarity footpoint. In the last row we show the campfire event in HRIEUV. The maximum brightness of this event is reached around 17:16 UT. The area just above the campfire event in the HRIEUV images is overexposed. The plotted region has dimensions of 11 × 11 Mm2.
Current usage metrics show cumulative count of Article Views (full-text article views including HTML views, PDF and ePub downloads, according to the available data) and Abstracts Views on Vision4Press platform.
Data correspond to usage on the plateform after 2015. The current usage metrics is available 48-96 hours after online publication and is updated daily on week days.
Initial download of the metrics may take a while.