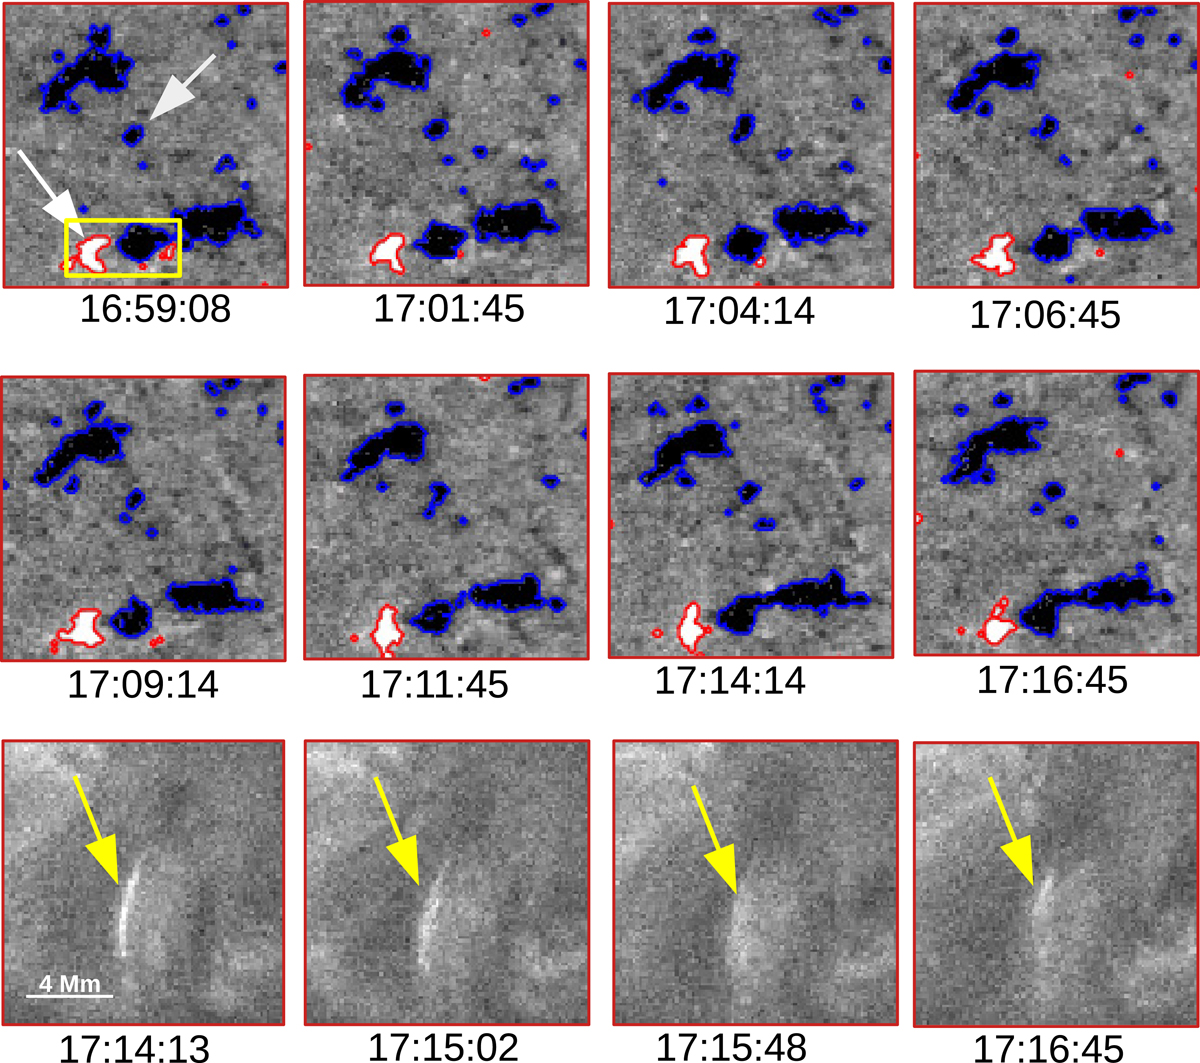
Fig. 4.
Download original image
SO/PHI magnetic field distribution below a campfire event of Category Ia. The top two rows are the eight subregions (13 × 15 Mm2) of the SO/PHI magnetograms below the campfire event. The white arrows in the first SO/PHI magnetogram at 16:59:08 UT point to the location of the two main footpoints of the campfire. The yellow box contains the positive main polarity and the opposite polarity feature interacting with it. The last row displays the co-aligned area in HRIEUV for four images acquired within the last two SO/PHI magnetograms (i.e. between 17:14:13 UT and 17:16:45 UT). The yellow arrow in the last row indicates the location of the campfire event which has a loop-like structure. The maximum brightness of this event according to the detection algorithm of Berghmans et al. (2021) is achieved around 17:15:23 UT.
Current usage metrics show cumulative count of Article Views (full-text article views including HTML views, PDF and ePub downloads, according to the available data) and Abstracts Views on Vision4Press platform.
Data correspond to usage on the plateform after 2015. The current usage metrics is available 48-96 hours after online publication and is updated daily on week days.
Initial download of the metrics may take a while.