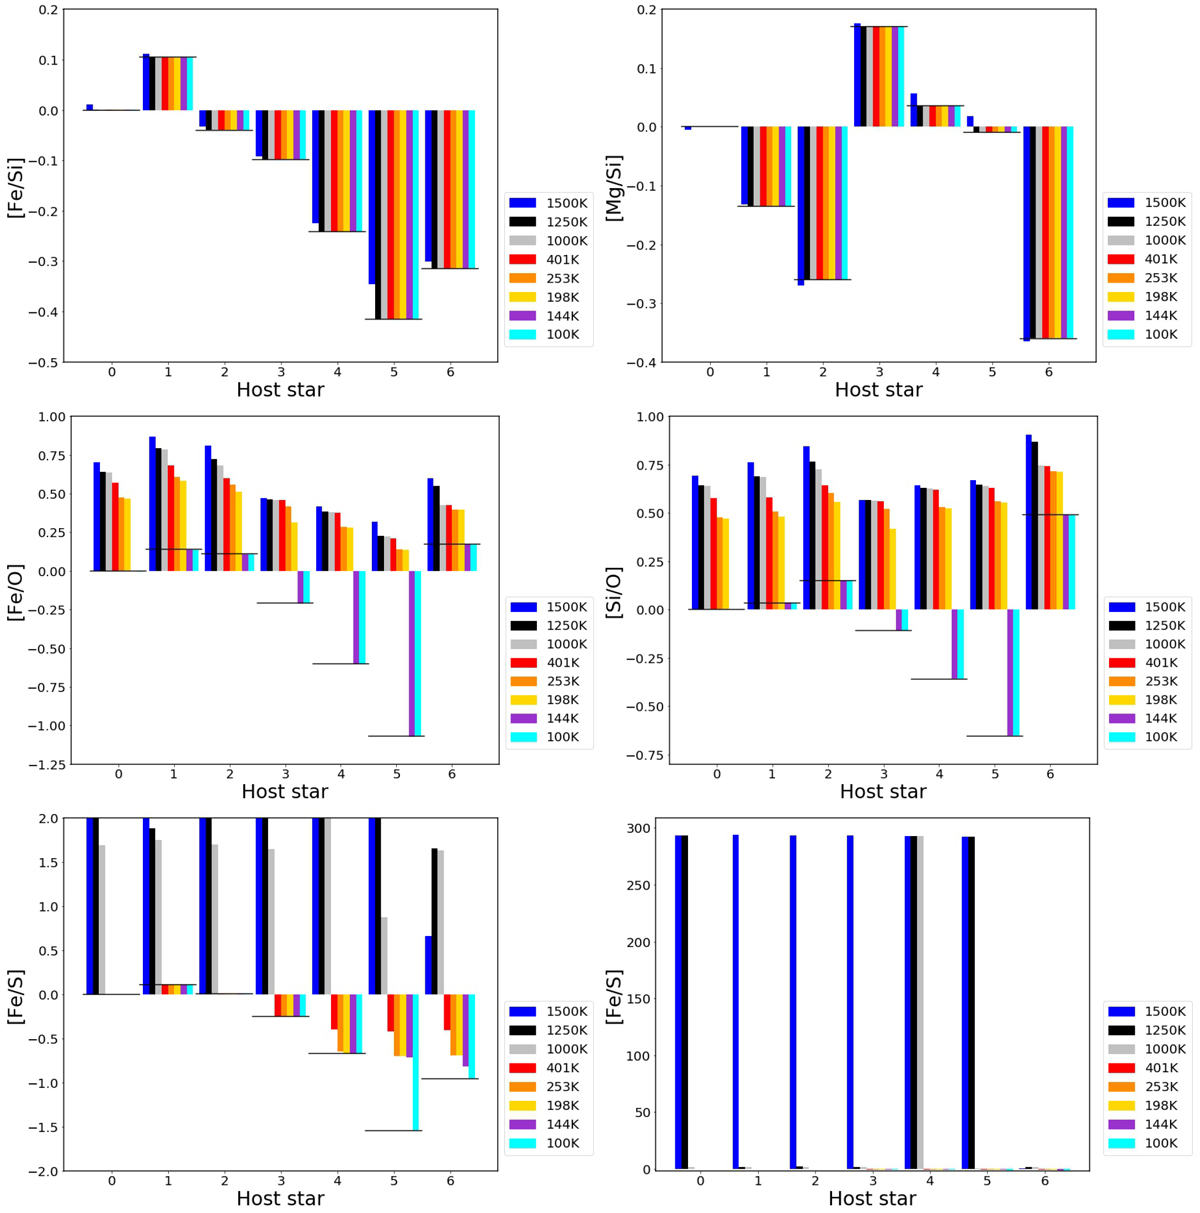
Fig. 5
Download original image
Ratios found in the condensed phase from which the hypothetical planets form. The ratios are normalised by the solar abundance values. The x-axis labelled from 0 to 6 represents the host star where the planets formed. A black horizontal line is drawn to represent the initial value of the ratio in the gas phase. The bottom-right panel is an extension of the bottom-left panel.
Current usage metrics show cumulative count of Article Views (full-text article views including HTML views, PDF and ePub downloads, according to the available data) and Abstracts Views on Vision4Press platform.
Data correspond to usage on the plateform after 2015. The current usage metrics is available 48-96 hours after online publication and is updated daily on week days.
Initial download of the metrics may take a while.