Fig. 8
Download original image
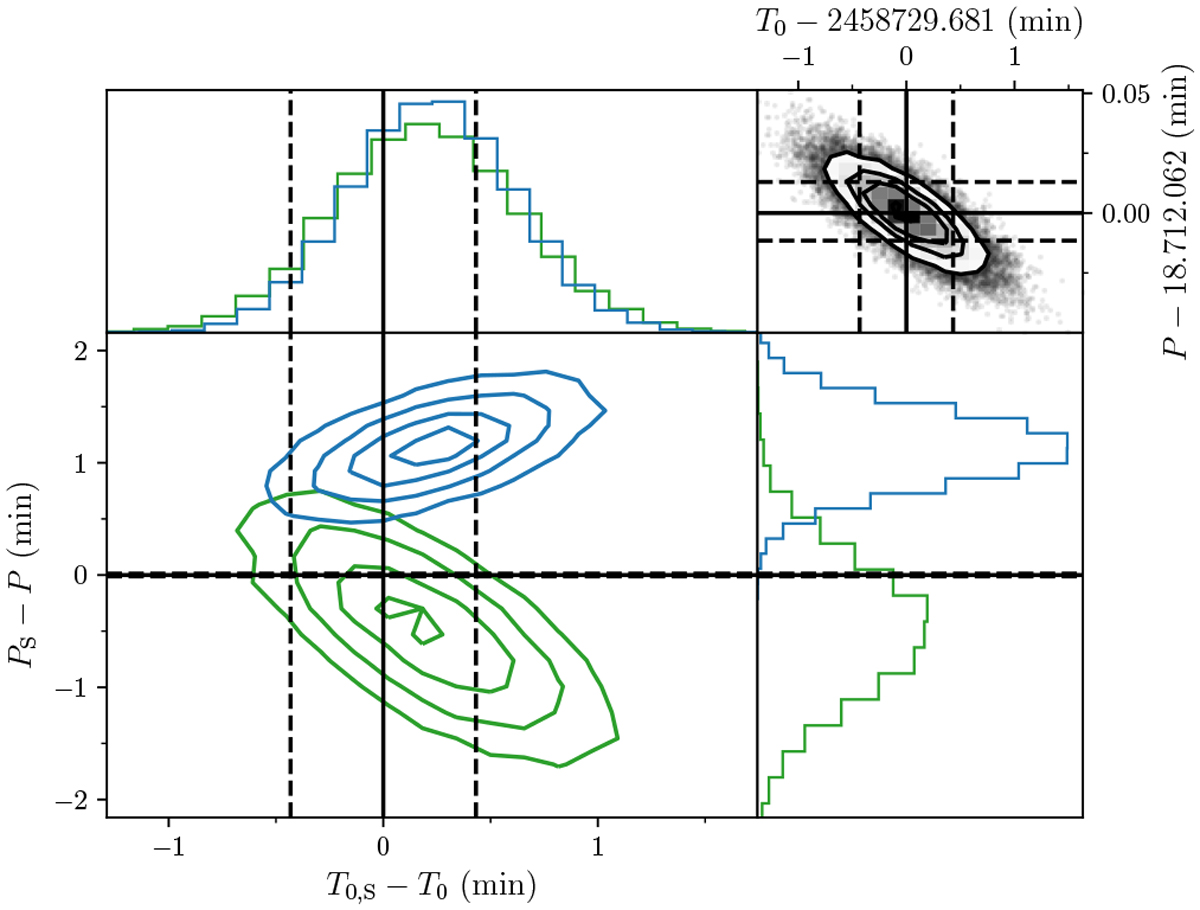
Correlation between P and T0. Fit varying P and T0, but otherwise fixing the parameters from the RV run in Table 2. In blue we only fit the transits in Sectors 14 and 15, and in green we only fit the transits from Sector 41. We have subtracted P and T0 from Table 2 from the results. Displayed in the top right corner are the posteriors for these, and their values and confidence intervals are shown as black lines in both correlation plots. Furthermore, we used this period to shift T0 from Sector 41, i.e. subtracting 37 × P. The confidence intervals for the period, translating to different mid-transit points for different epochs, are only marginally consistent, indicating the possibility of TTVs.
Current usage metrics show cumulative count of Article Views (full-text article views including HTML views, PDF and ePub downloads, according to the available data) and Abstracts Views on Vision4Press platform.
Data correspond to usage on the plateform after 2015. The current usage metrics is available 48-96 hours after online publication and is updated daily on week days.
Initial download of the metrics may take a while.