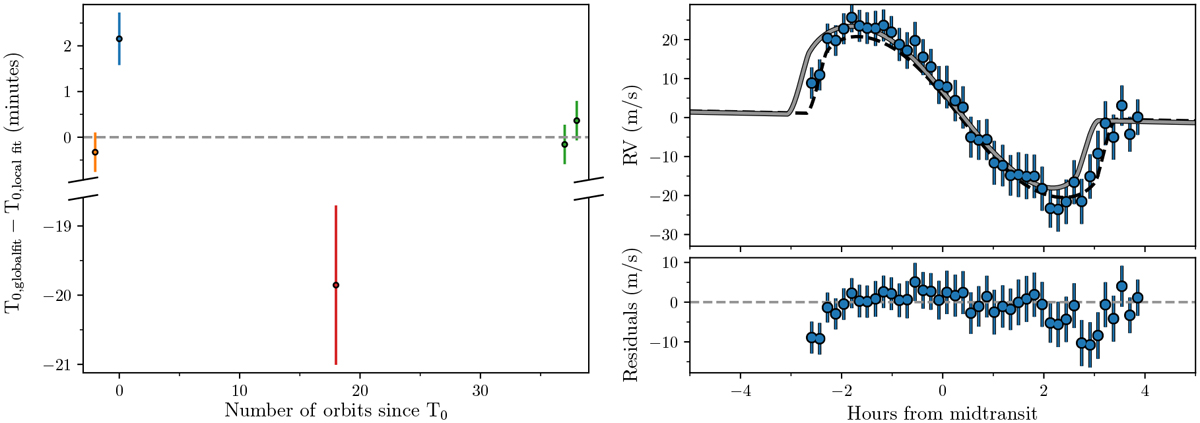
Fig. 7
Download original image
Transit timing differences. Left: timing differences between the predictions of transit midpoints derived from linear ephemeris obtained via a global fit to all photometric data and transit midpoints measured for each of the transits individually (including the spectroscopic transit), i.e., T0 from Table 2. We also show a local fit, where T0 is free to vary for each of the specific transits. The transits from TESS Sectors 14, 15, and 41 are plotted in orange, blue, and green, respectively. The transit observed with HARPS-N is plotted with a red symbol. The spectroscopic transit is offset by several σ from its expected timing. Right: similar to Fig. 6 panel c, but now assuming linear ephemeris resulting in a misaligned (λ = −31 ± 6°) orbit shown in grey. Clearly, this model does not fit the data as well as the dashed line, which is the model in panel c of Fig. 6. The lower panel displays the residuals between the linear ephemeris model and data. There are large systematic differences between data and model, specifically near ingress and egress, as expected if there is a timing offset.
Current usage metrics show cumulative count of Article Views (full-text article views including HTML views, PDF and ePub downloads, according to the available data) and Abstracts Views on Vision4Press platform.
Data correspond to usage on the plateform after 2015. The current usage metrics is available 48-96 hours after online publication and is updated daily on week days.
Initial download of the metrics may take a while.