Fig. 6
Download original image
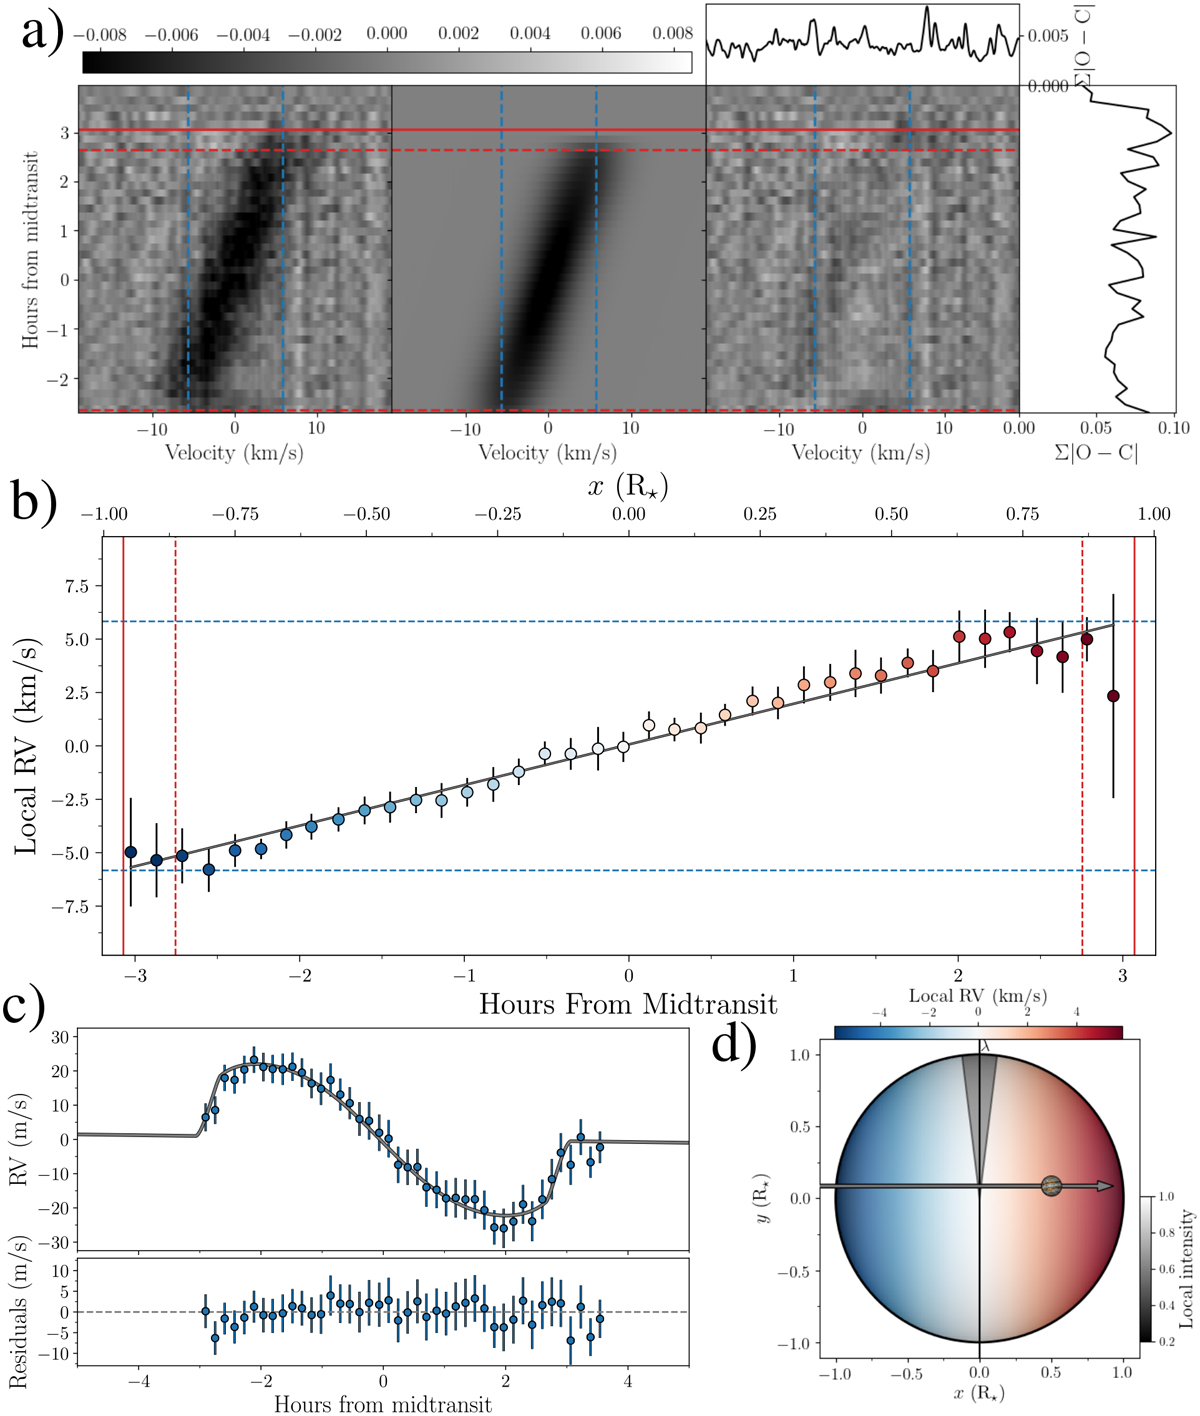
Three approaches to measuring λ. (a) Left: distortion of the stellar absorption lines as observed with HARPS-N during the transit night. The vertical lines denote ± v sin i. The horizontal dashed lines are the second and third contact, i.e. the times in between is when the planet is completely within the stellar disc, and the solid line is the fourth contact, i.e. the point where the stellar and planetary discs no longer overlap. Middle: Best-fitting model of the distortion of the absorption lines. Right: residuals from subtracting the best-fitting model from the data with the summed values displayed on top and to the right. In all panels, data and model have been shifted into the stellar rest frame, a minor effect. The horizontal colour bar at the top denotes the strength of the signal. (b) Subplanetary or local RVs created by subtracting the OOT CCF from the in-transit ones and measuring the position of the excess bump caused by the planet. The error bars are colour-coded according to the v sin i value they should have given their x-position in (d), which shows the orientation of the orbit and the projected stellar rotation going from blue (–v sin i) to red (v sin i). As in (a), the dashed blue line denotes the value for v sin i, while the solid and dashed red lines mark the contact points. (c) Top: RVs from HARPS-N used in the fit (shown with blue error bars). The grey line is the best-fitting model of the RM effect. (c) Bottom: residuals from subtracting the best-fitting model from the data. (d) Geometry of the system with the planet transiting the rotating and limb-darkened star, which is tilted by λ with respect to the orbit of the planet marked with the grey arrow. The horizontal colour bar shows the rotation speed at a given longitude, and the grey colour bar shows the relative intensity given going from 1.0 in the centre to around 0.16 at the limb (given the limb-darkening parameters for HARPS-N in Table 2). Here the intensity overlay has been made transparent to make the rotation colour-coding visible.
Current usage metrics show cumulative count of Article Views (full-text article views including HTML views, PDF and ePub downloads, according to the available data) and Abstracts Views on Vision4Press platform.
Data correspond to usage on the plateform after 2015. The current usage metrics is available 48-96 hours after online publication and is updated daily on week days.
Initial download of the metrics may take a while.