Fig. 4
Download original image
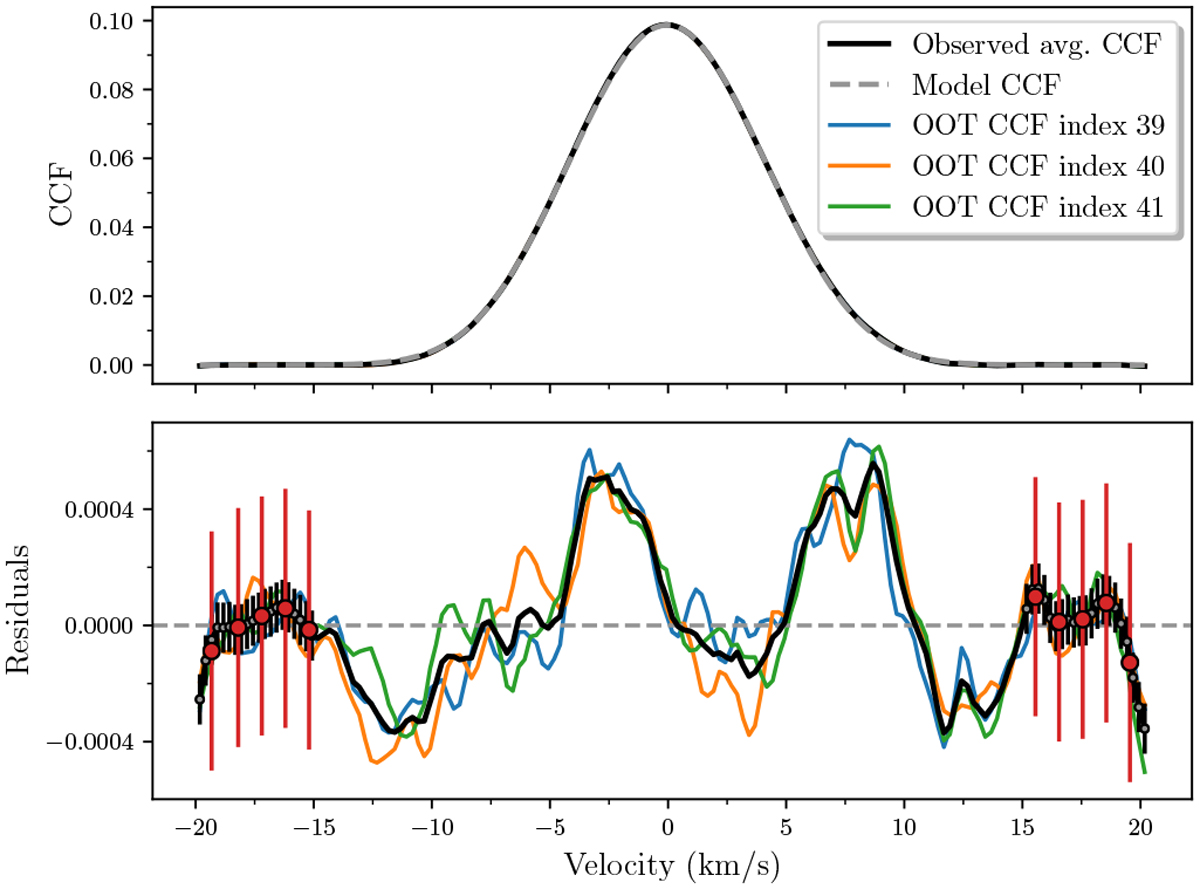
Out-of-transit cross-correlated-functions. Top: average observed CCF (created from the three OOT CCFs) shown as the solid black line with the best-fitting model overlain as the grey dashed line. The surface area under the CCF was arbitrarily set to 1. All CCFs have been shifted into the stellar rest frame. Bottom: residuals between the OOT CCF and model. We also show the three epochs used to create our average out of transit CCF, i.e. the three last observations on the 4 August, 2020(Indexing started with 0). Shown as grey error bars is the scatter on the CCFs outside of the central peak, specifically ±15 km s−1, which we have binned to 1 km s−1 and scaled to get a ![]() . The binned and scaled errors are shown with red error bars, which are applied to all data points, but for illustrative purposes are only shown in the aforementioned range.
. The binned and scaled errors are shown with red error bars, which are applied to all data points, but for illustrative purposes are only shown in the aforementioned range.
Current usage metrics show cumulative count of Article Views (full-text article views including HTML views, PDF and ePub downloads, according to the available data) and Abstracts Views on Vision4Press platform.
Data correspond to usage on the plateform after 2015. The current usage metrics is available 48-96 hours after online publication and is updated daily on week days.
Initial download of the metrics may take a while.