Fig. 1
Download original image
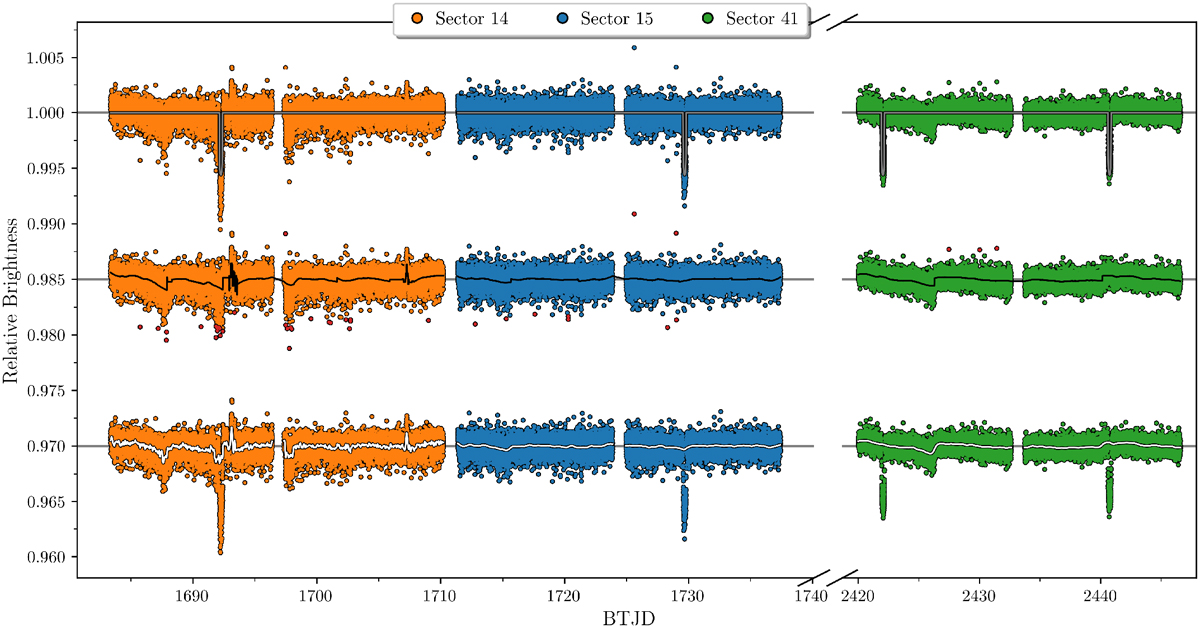
TESS light curve for HD 332231. The top curve is a normalised but not detrended light curve of HD 332231 as observed by TESS (top curve), with orange, blue, and green points corresponding to Sectors 14, 15, and 41, respectively. The grey line is a transit model created from the parameters in Dalba et al. (2020). The transit model has been used to temporarily remove the transit in the light curve offset by –0.015 (denoted as the straight line below the points). Here the black line shows a Savitsky-Golay filter (as implemented in Lightkurve Collaboration 2018) used to filter and detrend the data. The red points are outliers removed through a 5σ sigma clipping. The light curve with outliers removed and the transits re-injected is shown in the light curve offset by –0.03, where the white line shows the GP (see Sect. 3) used for detrending.
Current usage metrics show cumulative count of Article Views (full-text article views including HTML views, PDF and ePub downloads, according to the available data) and Abstracts Views on Vision4Press platform.
Data correspond to usage on the plateform after 2015. The current usage metrics is available 48-96 hours after online publication and is updated daily on week days.
Initial download of the metrics may take a while.