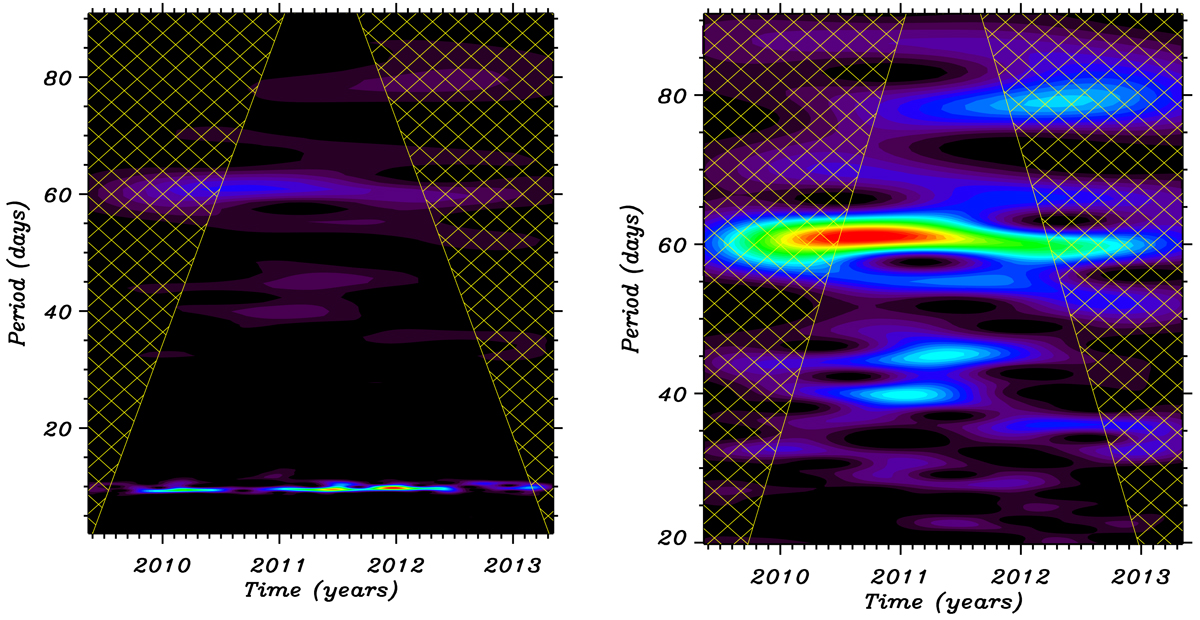
Fig. 2.
Download original image
Morlet wavelet analysis of light curve variations during entire Kepler observations. Left panel: spectrum of the periods between 1 and 90 days, and the right panel shows the periods between 20 and 90 days (Prot is removed). The hatched regions in the figure show the cone of influence, which means that the wavelet transform is not reliable in these areas.
Current usage metrics show cumulative count of Article Views (full-text article views including HTML views, PDF and ePub downloads, according to the available data) and Abstracts Views on Vision4Press platform.
Data correspond to usage on the plateform after 2015. The current usage metrics is available 48-96 hours after online publication and is updated daily on week days.
Initial download of the metrics may take a while.