Fig. 1.
Download original image
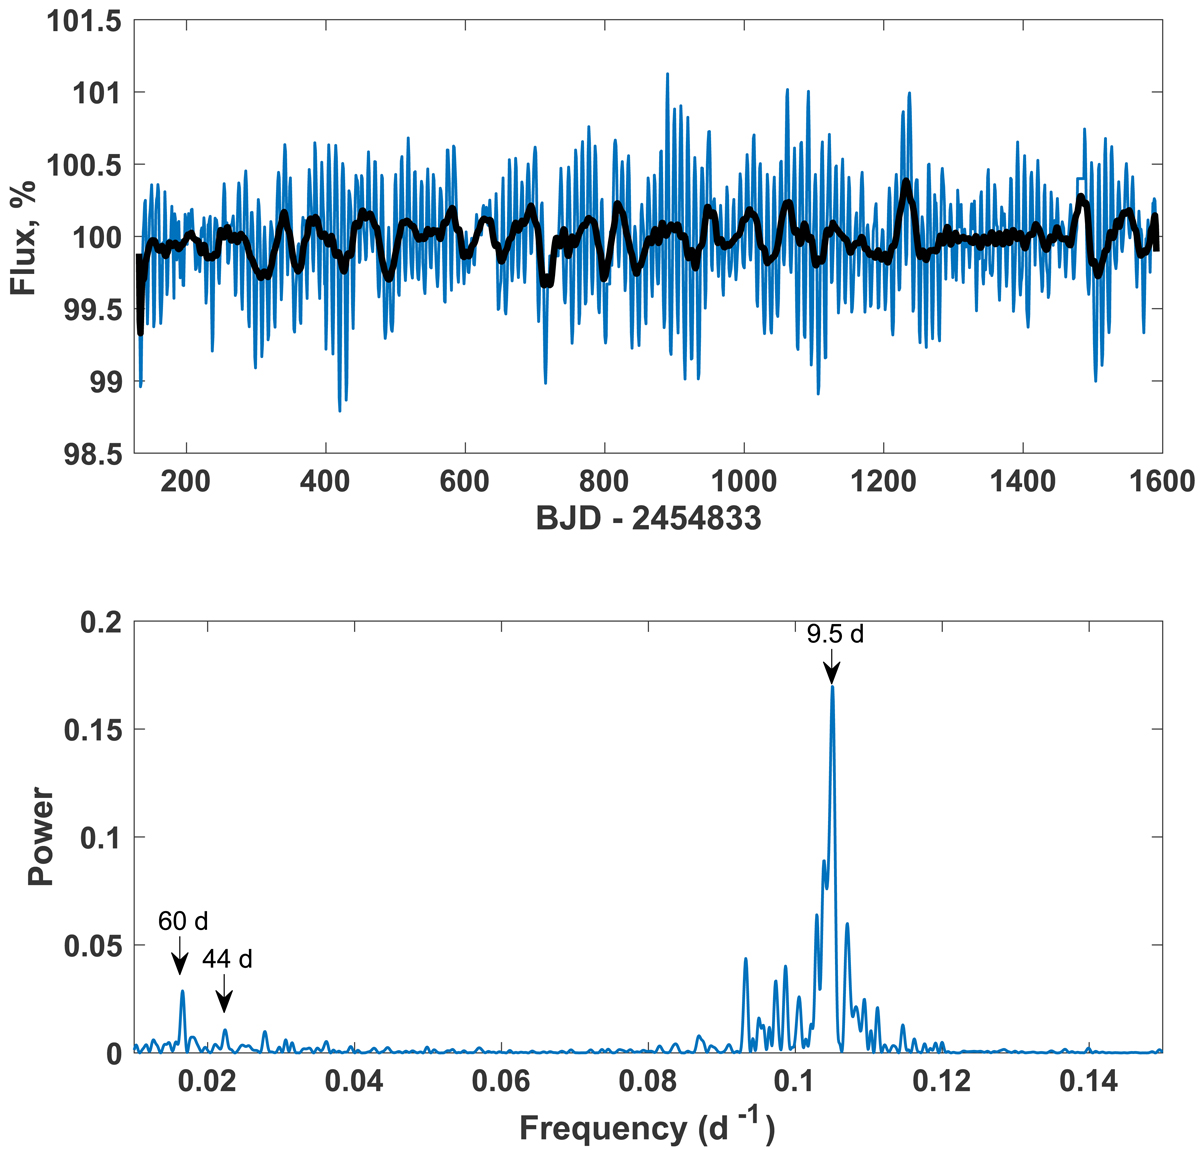
Time series of the Kepler star KIC 2852336 with solid black line denoting the 20-day moving average (upper panel) and the corresponding GLS power spectrum (lower panel). The frequency interval, which includes the periods between 1–90 days, is presented; the rotational periods of 9.5 d, 44 d and 58–61 d (indicated by black arrows), which may correspond to the Rieger cycle, are clearly seen.
Current usage metrics show cumulative count of Article Views (full-text article views including HTML views, PDF and ePub downloads, according to the available data) and Abstracts Views on Vision4Press platform.
Data correspond to usage on the plateform after 2015. The current usage metrics is available 48-96 hours after online publication and is updated daily on week days.
Initial download of the metrics may take a while.