Fig. 8.
Download original image
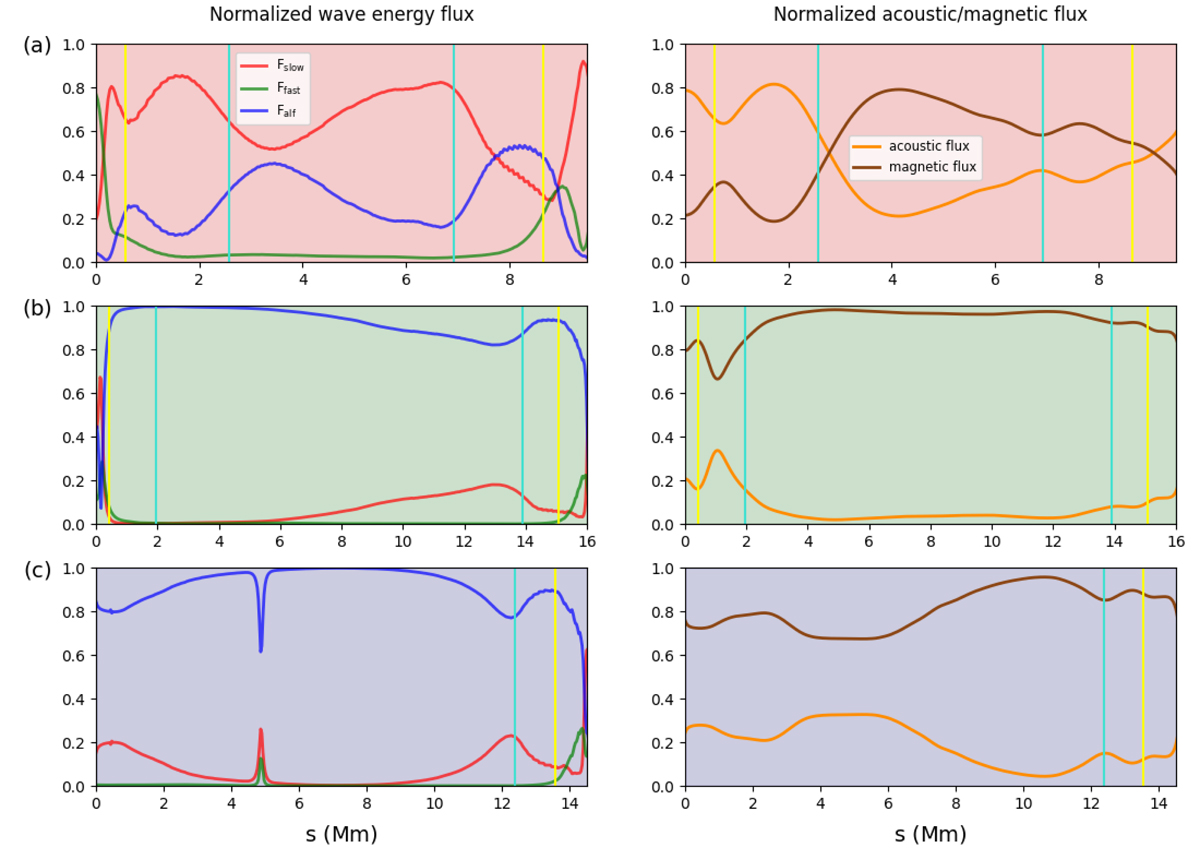
Energy flux comparison for the three selected surfaces also indicated as background colors: red (first row), green (second row), blue (third row). Left column: energy fluxes calculated using Eqs. (30)–(32): slow (red line), fast (green line), and Alfvén (blue line). Right column: acoustic (orange line) and magnetic (brown line) fluxes, calculated as the first and second terms in Eq. (29), respectively.
Current usage metrics show cumulative count of Article Views (full-text article views including HTML views, PDF and ePub downloads, according to the available data) and Abstracts Views on Vision4Press platform.
Data correspond to usage on the plateform after 2015. The current usage metrics is available 48-96 hours after online publication and is updated daily on week days.
Initial download of the metrics may take a while.