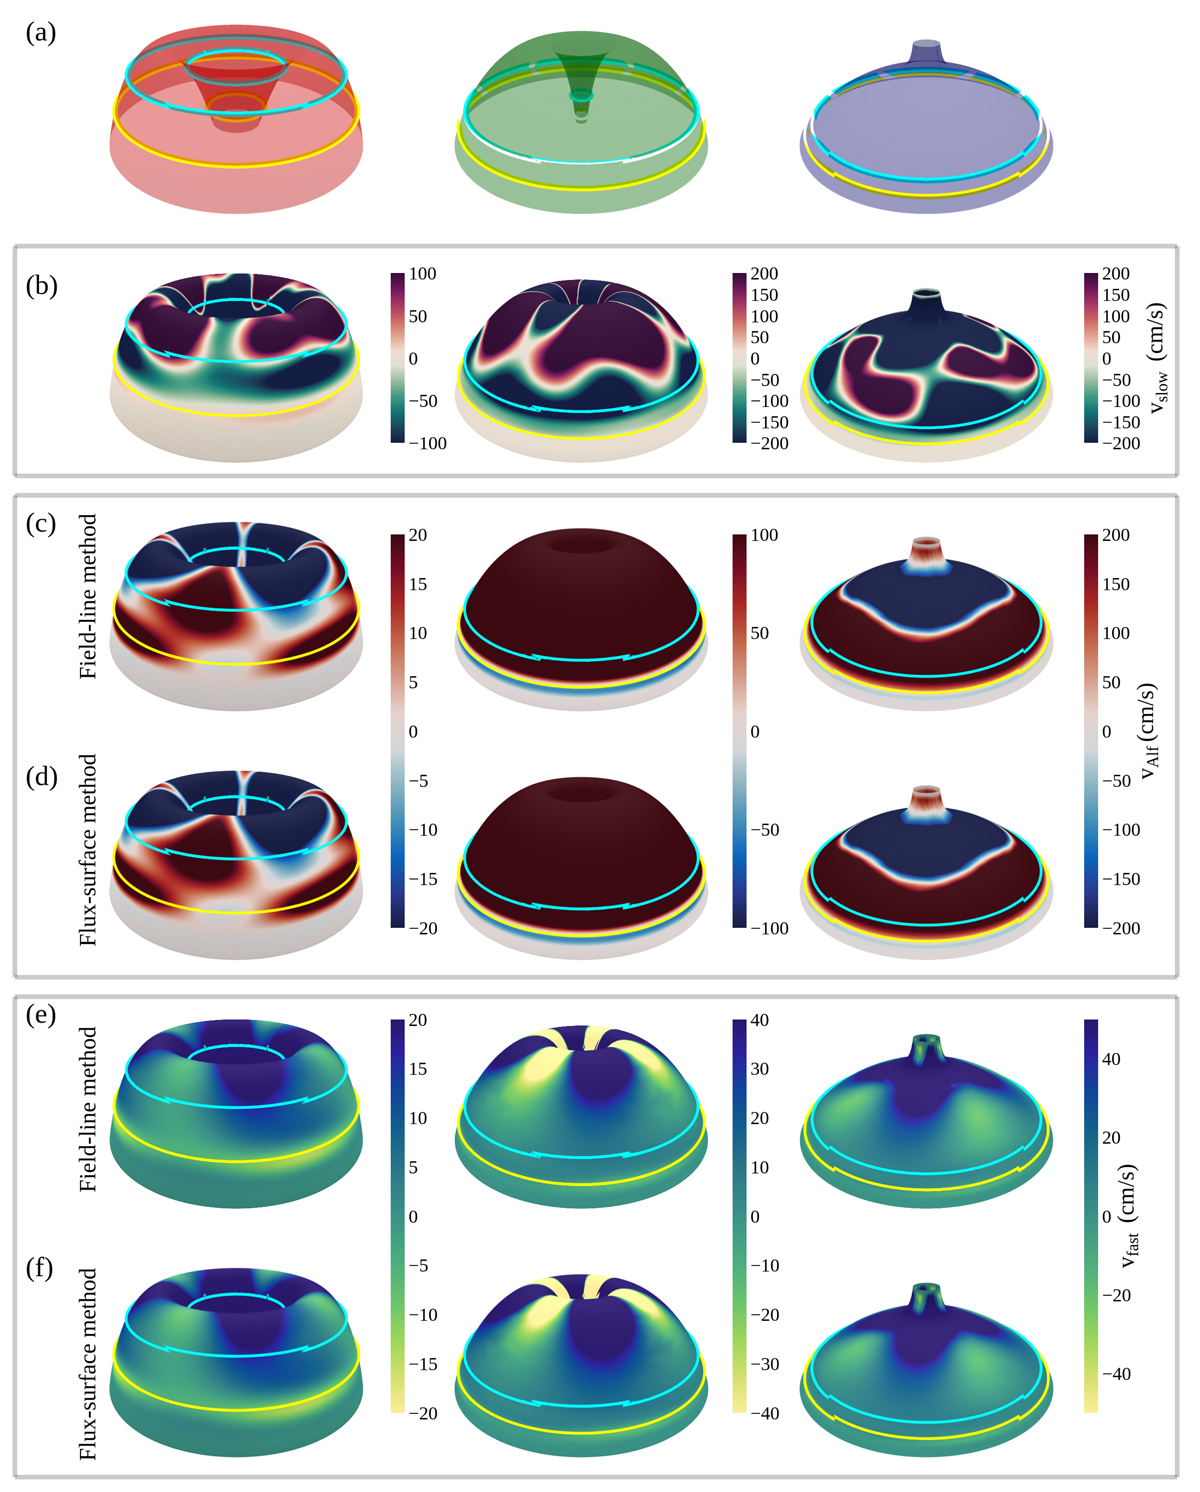
Fig. 7.
Download original image
Comparison and validation of the proposed wave mode decomposition method with the previously used method: selected magnetic flux surfaces are shown in row a; velocity component associated with slow magneto-acoustic wave is shown in row b; velocity component associated with fast magneto-acoustic wave and Alfvén wave using our new method is shown in rows c and e, respectively; velocity component associated with fast magneto-acoustic wave and Alfvén wave using the method used by Mumford et al. (2015) is displayed in rows d and f, respectively. Over-plotted yellow and turquoise solid line curves represent the Alfvén-acoustic equipartition layer and the transition region, respectively.
Current usage metrics show cumulative count of Article Views (full-text article views including HTML views, PDF and ePub downloads, according to the available data) and Abstracts Views on Vision4Press platform.
Data correspond to usage on the plateform after 2015. The current usage metrics is available 48-96 hours after online publication and is updated daily on week days.
Initial download of the metrics may take a while.