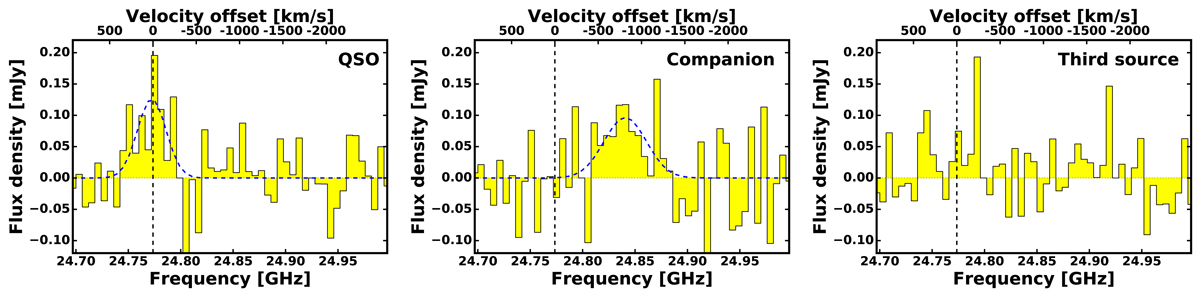
Fig. 3.
Download original image
CO(1–0) emission line of SDSS J160705+533558. The extracted CO(1–0) line spectra of the quasar, its companion, and the additional source to the south of the quasar. The spectra are binned to 72.6 km s−1 per channel, and the continuum is subtracted. The dashed blue curves show the Gaussian fits to the line profiles. The vertical dashed line indicates the optical redshift of the quasar (z = 3.653). The top-axis show the relative velocity offset with respect to the optical redshift of the quasar.
Current usage metrics show cumulative count of Article Views (full-text article views including HTML views, PDF and ePub downloads, according to the available data) and Abstracts Views on Vision4Press platform.
Data correspond to usage on the plateform after 2015. The current usage metrics is available 48-96 hours after online publication and is updated daily on week days.
Initial download of the metrics may take a while.