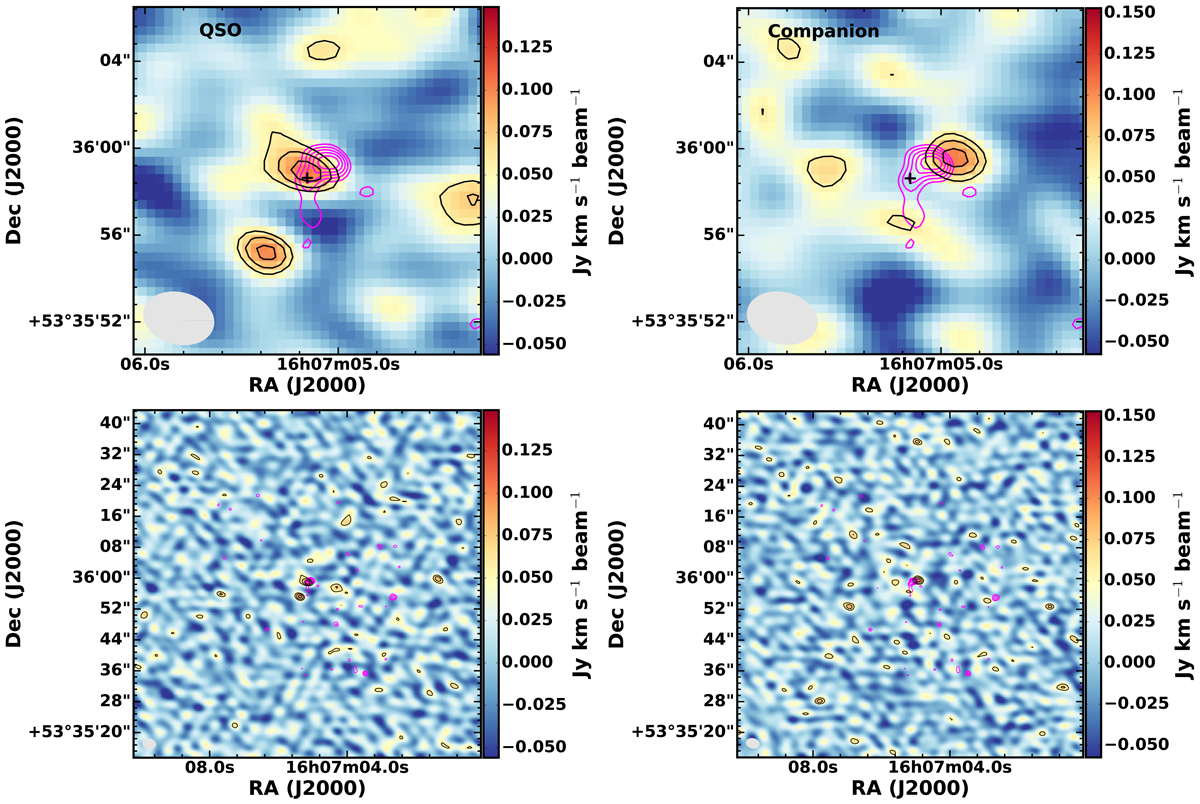
Fig. 2.
Download original image
CO(1–0) emission of SDSS J160705+533558. Top: integrated intensity (moment-0) maps of the quasar and the companion. The moment-0 maps are integrated over the velocity range of [−267, 382] km s−1 ([24.74, 24.79] GHz) in the case of the quasar and [−1288, −426] km s−1 ([24.801, 24.88] GHz) for the companion. The black contour levels are at [3, 4, 5]×σ, where σ = 0.019 Jy beam−1 km s−1. The magenta contours show the 850 μm SMA continuum of the source, with the same contour levels as in Fig. 1. The black cross marks the position of the quasar. The beam size is indicated as a grey ellipse in the bottom left corner. Bottom: large-scale moment-0 maps of the quasar and the companion.
Current usage metrics show cumulative count of Article Views (full-text article views including HTML views, PDF and ePub downloads, according to the available data) and Abstracts Views on Vision4Press platform.
Data correspond to usage on the plateform after 2015. The current usage metrics is available 48-96 hours after online publication and is updated daily on week days.
Initial download of the metrics may take a while.